Carlsbad, NM 88220, USA apartments for sale
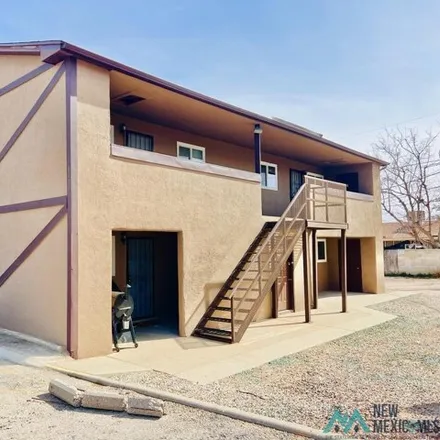
$619,444
$619,444
Available: Right Now
Recently remodeled units feature open floorplans with large eat-in kitchens, living areas with woodburning fireplaces, and bedrooms with plenty of storage all complimented by custom woodwork and quality, hardy contemporary finishes throughout. Add al...
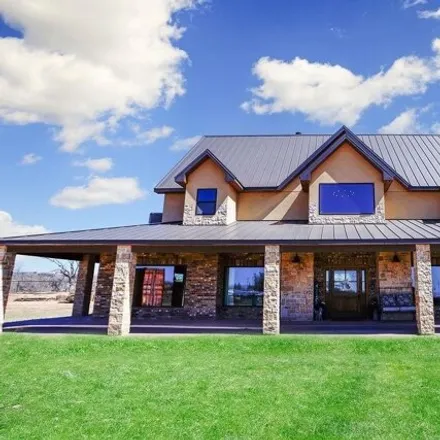
$1,5M
$1,5M
Available: Right Now
Welcome home to this exquisite custom built 2 story country home nestled away on 3 acres in beautiful La Huerta! This charming home seamlessly blends timeless appeal of craftsmanship, luxury and comfort. Step inside and be amazed by this thoughtful, ...
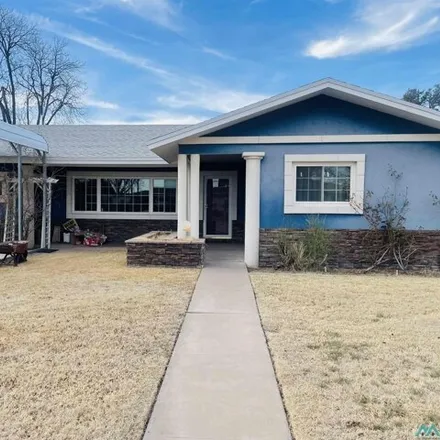
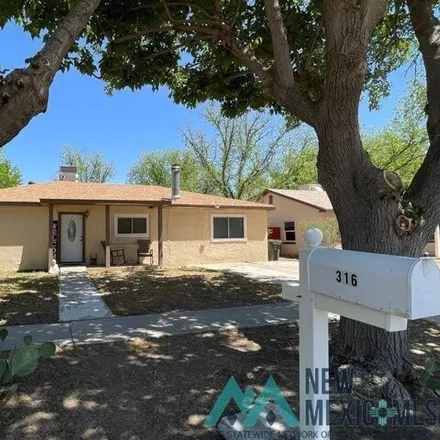
$335,000
$335,000
Available: Right Now
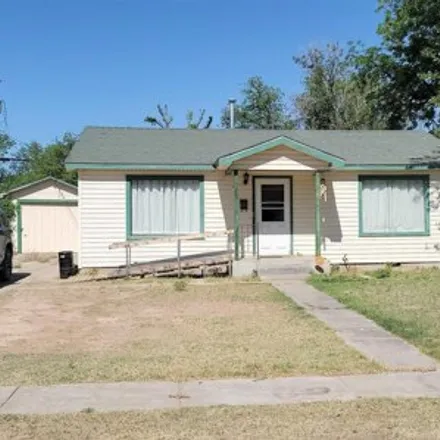
Welcome to your dream home! This beautiful property boasts ample living space, featuring 4 spacious bedrooms and 2 bathrooms, perfect for your family's comfort. The home comes with the added convenience of all windows being replaced in 2014, ensuring...
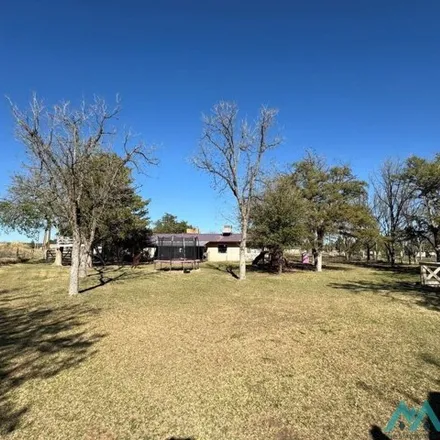
$364,750
$364,750
Available: Right Now
Beautiful country setting property at the end of the street! The pie shaped acreage has mature pecan trees, a 20x12 storage building/shed with electricity , cid water rights, and a 2-car 26x26 carport. The 30x24 shop has spray foam insulation,...
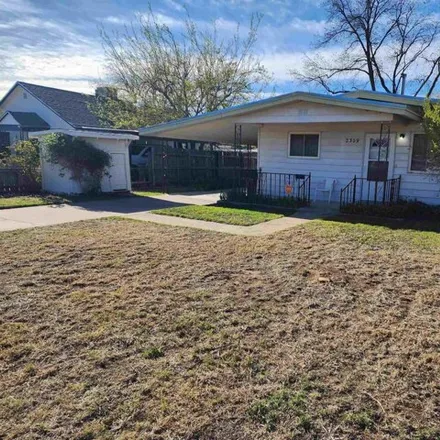
$175,000
$175,000
Available: Right Now
Looking for a place that is close to just about everything in town? Look at this cute and cozy, centrally located 2 bedroom, 1 bath home with hardwood floors, a garage with an additional storeroom, firepit in the back yard and block fence for privacy...
$330,000
$330,000
Available: Right Now
Country living close to city limits. Have a look at this beautiful home that features a modern kitchen with a large pantry, dining area, large utility room, wood burning fireplace, and large island. Throughout this home there is plenty of counter and...
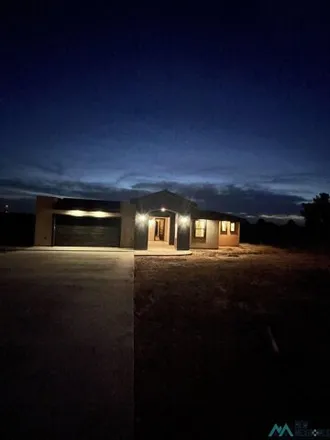
$224,000
$224,000
Available: Right Now
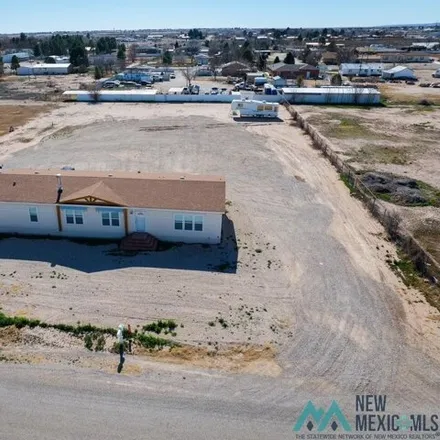
Nestled outside the city limits of Carlsbad, this property offers the perfect combination of peace and convenience. Enjoy the serenity of rural living while still being just a short drive away from shopping, dining, schools, and recreational amenitie...

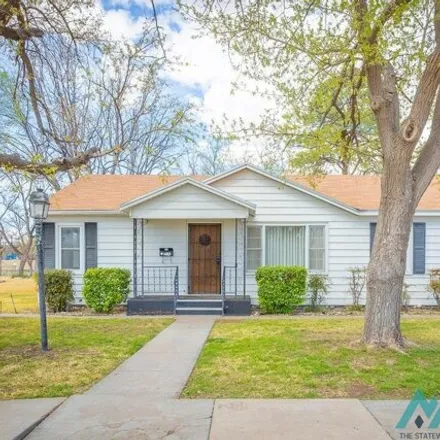
$230,000
$230,000
Available: Right Now
Charming home that has been lovingly maintained. Upon entry, the original bottle base textured glass will catch your eye. Once inside, you will find fresh paint, carpet, vinyl, and tile throughout the home. Both bathrooms have been completely remodel...

$530,000
$530,000
Available: Right Now
Looking for spacious home in a cozy cul-de-sac? This is the house to make a home. Located on the North side of town in a kid friendly neighborhood. This Southwestern/Pueblo style home is authentic in its design from the saltillo flooring, light fixtu...
$450,000
$450,000
Available: Right Now
Welcome to 1410 Ferguson Road. This brick home, built in 2001 sit on 4 spacious acres of land and offers CID water rights. Step inside and you will find 2312 sq. feet of living space, featuring 4 bedrooms and 2 1/2 baths. The cozy living room include...
$270,000
$270,000
Available: Right Now
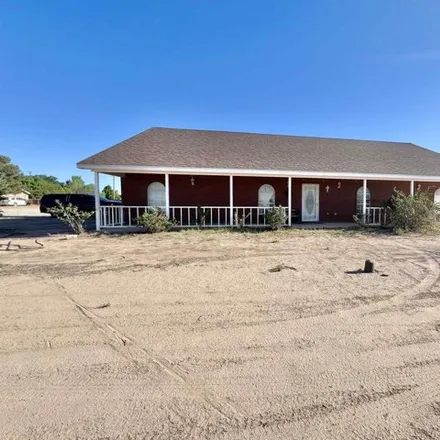
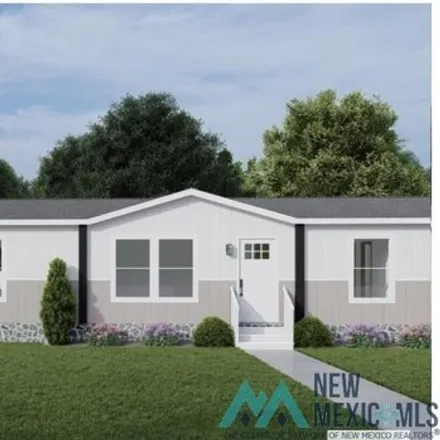
This property to be completed by end of February This 5-bedroom, 3 bath home features a utility room, big kitchen island, large primary bedroom with walk-in closet, and will be on permanent foundation. The front yard will be landscaped, and back yard...
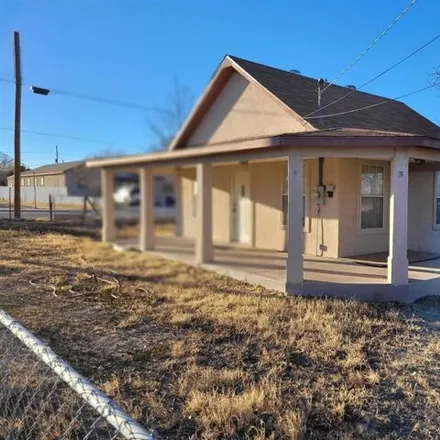
$189,800
$189,800
Available: Right Now
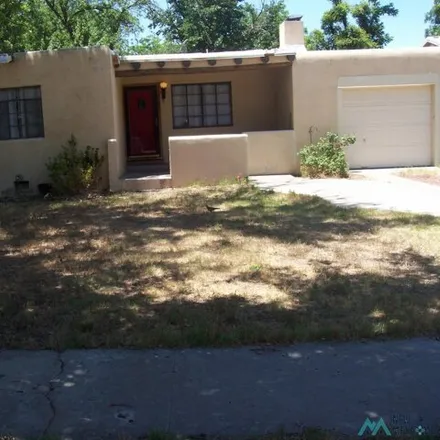
Pueblo style home! This home offers 2 bedrooms and 2 full baths. Formal living room with fireplace. Spacious den with built in book cases. Dining area and cozy kitchen. Small study room. Wood floors and decorative vigas throughout. Compact garage and...
$340,000
$340,000
Available: Right Now
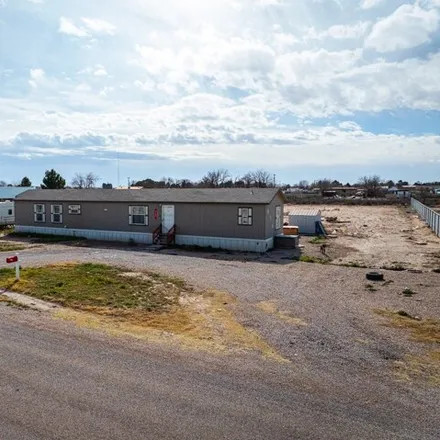
Great find !! 3 Bedroom, 2 Bath 1202 sq ft home split Floor Plan. This 2018 single wide manufactured home sits on a permanent foundation. The home features a large living room with sliding glass door that leads to the back deck. The Primary Su...
$220,000
$220,000
Available: Right Now
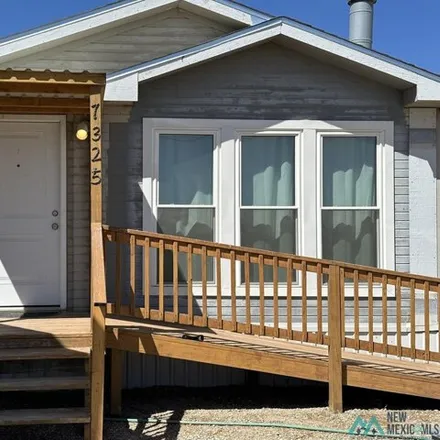
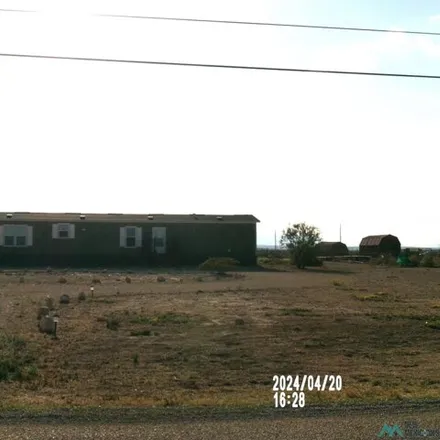
Welcome to your new home! Built in 2018, this single-wide home features 3 bedrooms and 2 full baths, offering both comfort and functionality. The inviting living spaces exude warmth, while the well-appointed bedrooms ensure restful nights. Enjoy the ...
$235,000
$235,000
Available: Right Now
Take a look at this home a short walk away from the Pecos River! Over 1700 sq ft, this home features 3 bedrooms 2 baths, living room + large family room which can also be used for formal dining, updated bathrooms, updated windows throughout the home,...
$205,000
$205,000
Available: Right Now
Don't miss this 3 bedroom 1-1/2 bath home! There is a formal dining area, eat-in kitchen, fireplace in the living room, updated bathrooms, updated windows, a large activity/utility room. Attached carport with storage room. A fenced backyard with two ...
$560,000
$560,000
Available: Right Now
Beautiful custom home by Marie! 4 bedroom 2 1/2 baths with many special touches. Custom made Cabinets and doors are Knotty Alder. Open floor plans with views out every room. Travertine floors, unique granite tops. Large utility room with lots of stor...
$425,000
$425,000
Available: Right Now
This 1949 traditional home sits just off the Pecos River and boasts 2 large lots on both sides of the home making this property large enough to build another home for family or a guest retreat. This home has been very well maintained and offers 3 bed...
$159,700
$159,700
Available: Right Now
A lovely 1 large bedroom, 1 bathroom, with a bonus room home. Step saver kitchen. Recessed light thought-out. Front and side covered porch. Freshly painted throughout. Carpet shampooed and cleaned. Installed new vanity and medicine cabinet. New elect...

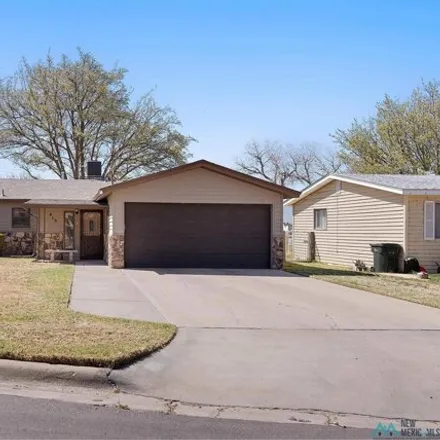
$240,000
$240,000
Available: Right Now
Take a look at this beautiful 3-bedroom 2 bath home! This home features tile throughout, newer appliances, a good size backyard, woodburning fireplace. You will be close to the new schools coming to the area soon!! This is a great starter home, inves...
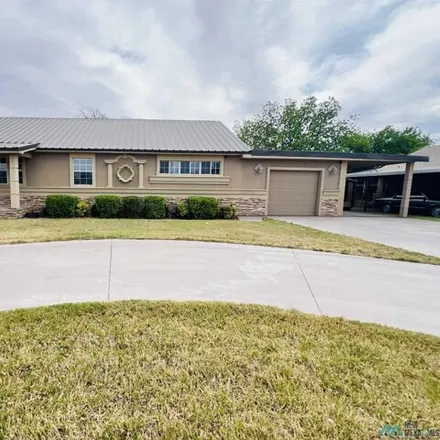
$250,000
$250,000
Available: Right Now
This charming house is perfect for those looking for a well maintained, comfortable living space. This property features a fenced backyard and a front and back sprinkler system, making it ideal for enjoying the beautiful outdoors. The kitchen boasts ...
$299,000
$299,000
Available: Right Now
Welcome to416 N.Mesa Street. Check out this stunning renovated home with a bonus casita featuring 591 sq. feet offering 1 bed, 1 bath and 1 car carport. The main house offers 1712 sq feet. 4 bedrooms, 2 bathrooms, 1 car attached garage and 1 car carp...
Carlsbad
According to statistics, the population in Carlsbad, NM amounts to 28,393, which shows growth 1% compared to the previous year. The median age of the city’s residents is 36. The average household income is $62,932, shifting growth 8% from the past year, and the average property value in Carlsbad, NM growth 6% to $133,000 throughout the year.
What is the Average Price of Apartments for Sale in Carlsbad, NM, 88220?
| Month | Median Price |
|---|---|
| Apr 2024 |
$1,358,964
|
| Mar 2024 |
$1,392,250
|
| Feb 2024 |
$1,392,250
|
| Jan 2024 |
$1,392,250
|
| Dec 2023 |
$1,148,377
|
| Nov 2023 |
$1,148,377
|
Household Income
The average household income in Carlsbad, NM grew from $58,292 to $62,932 in the past year. This data is an estimate based upon 10,708 households in Carlsbad, NM . The chart below presents how household income is distributed in Carlsbad, NM in comparison to the revenue allocation amid households nationally.
Property Value
According to data from last year, the average property value in Carlsbad, NM shifted from $125,300 to $133,000 throughout the year. The subsequent graph indicates the share of properties in the given price range in Carlsbad, NM in comparison to the median property value in the same price segment across the country. According to the data, the greatest share of Carlsbad, NM properties falls in the '$150,000 to $174,999' range, which is lower than the most significant median property across the country.
Property Taxes
One of the most important aspects for property owners is the amount of property taxes. This graph shows distribution of property taxes in Carlsbad, NM compared to median property taxes around the country. The prevalent amount of property taxes in Carlsbad, NM equals $800, which is less than the national average.