Carpinteria, CA, USA apartments for sale
$1,78M
$1,78M
Available: Right Now
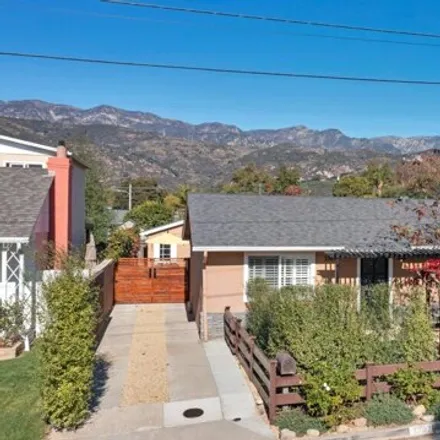
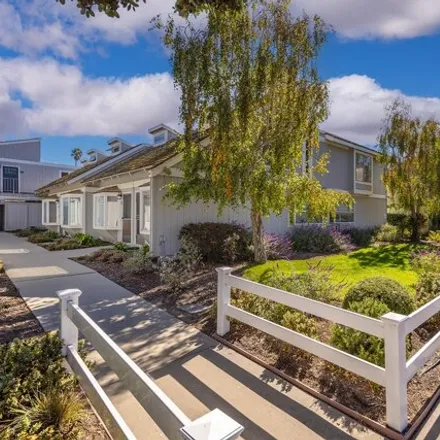
Two adorable and picture perfect houses on one lot with gorgeous view of mountains, two kitchens, two baths, custom heated pool and hot tub, two fountains, hardwood floors, incredible detail and charm, quiet street, has two addresses, 1387 and 138...
$839,000
$839,000
Available: Right Now
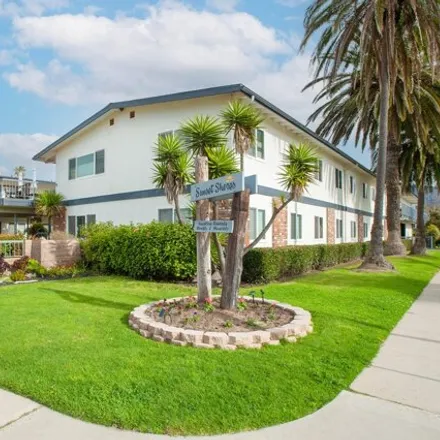
Located across the street from the ''World's Safest Beach''! This delightful one bedroom, one bath condominium, with an ocean view, has been beautifully refurbished. Perfect for a vacation retreat or full time enjoyment. This unit can be rented long ...

$12,5M
$12,5M
Available: Right Now
On the sand with panoramic ocean, island, mountain and bird sanctuary views and in the coveted guarded and gated Sandyland Cove enclave, this is a charming 2/2 seaside home with 3/2 guest house. Within the Cove, this home is perfectly situated well a...
$4,3M
$4,3M
Available: Right Now
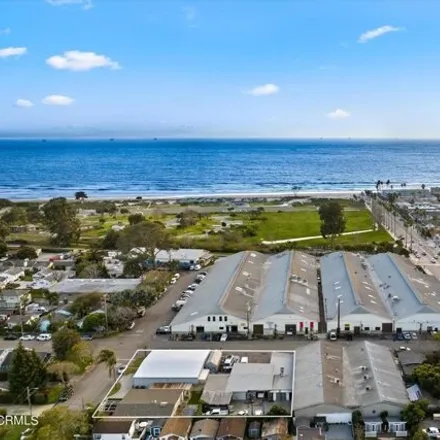
Calling all investors and developers! You won't want to miss out on this rare opportunity located in the heart of Downtown Carpinteria. This prime corner location offers significant potential for investment and is a dream come true for anyone looking...

$525,000
$525,000
Available: Right Now
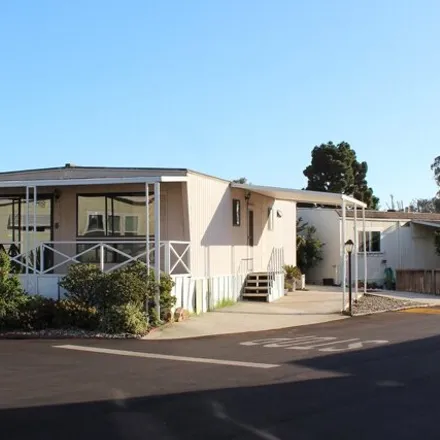
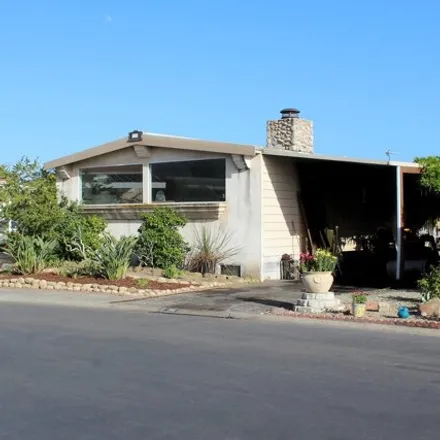
Come take advantage of this Rancho granada 55 + community's diamond in the rough. This manufactured home features two bedrooms and two bathrooms, covered and partially enclosed patio. Enjoy an open floor plan, updated kitchen and bathrooms. Ra...

$849,000
$849,000
Available: Right Now
Lovely Bright Home in the Villa Pinos Community. Freshly painted with brand new kitchen appliances, vinyl plank flooring and carpet - this home has an extra large sunny patio with easy access to 2 car garage and greenbelt. Move in ready - this gem is...

$625,000
$625,000
Available: Right Now
Unique opportunity to own this one-of-a-kind condo! This two-bedroom, one-bathroom unit features a recently remodeled kitchen, newly installed tile counters, and a one-car garage, making it excellent for first-time buyers or investors. Nestled in a q...

$1,2M
$1,2M
Available: Right Now
Charming Fixer-Upper in Quaint Carpinteria! Dive into the vintage beach town of Carpinteria, where small-town charm meets coastal living. This appealing 4-bedroom, 2-bathroom home, located just one block from Canalino Elementary, is bursting with pot...

$2,4M
$2,4M
Available: Right Now
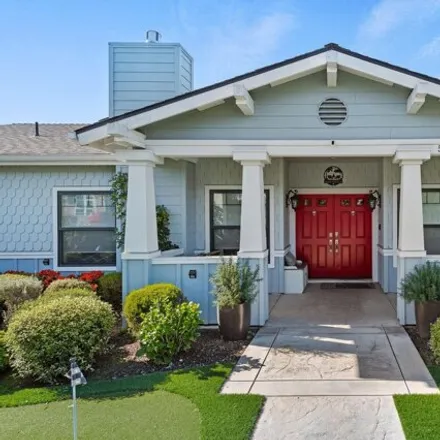
Experience both comfort and sophistication at this remarkable Carpinteria residence, where stunning mountain views await. Inside, an open floor plan boasts wood and tile flooring, luxurious tiles adorn the kitchen and bathrooms, while vaulted ceiling...

$529,000
$529,000
Available: Right Now
Discover your dream coastal retreat in the heart of Carpinteria's most sought-after mobile home community, Sandpiper Village. Nestled at the base of picturesque hills just off the Santa Monica Blvd exit on the101 FWY,this fully renovated mobile home ...

$3,5M
$3,5M
Available: Right Now
Prime downtown Carpinteria 4-plex. Original duplex on front of 8th Street was built in the 1950's. The unit on the right has two bedrooms, one bath, a den, dining room and laundry room. The unit on the left has 2 bedrooms, living room, dining room, l...

$1,46M
$1,46M
Available: Right Now
Recently updated 3/bedroom 2/bathroom single level with a two car attached garage, large flat yard and patio BBQ area. New kitchen cabinets, quartz counters, stainless steel appliances and new vinyl plank flooring.Lot's of windows and natural light. ...
$280,000
$280,000
Available: Right Now
Fabulous views! Excellent opportunity on a corner lot with panoramic mountain views in San Roque Park. The existing 840 sq ft home is a 2-BD that has been converted to a 1-BD. Second BD can be reinstalled. This home could be replaced with a new home ...

$775,000
$775,000
Available: Right Now
Take a 2-minute walk to the beach for a gorgeous sunset or catch a wave in the famous Carp surf! Stroll the trails of the nearby Salt Marsh and enjoy striking mountain views. This condominium has been recently refurbished and is in move-in condition!...

$875,000
$875,000
Available: Right Now
Located at the rear of the Village complex with south facing orientation. Light and bright 3br 2bath updated 2nd story end unit. Features include , New windows and doors, updated Kitchen, Fire place, Cathedral ceilings, balcony overlooking green belt...
$775,000
$775,000
Available: Right Now
Gorgeous one bedroom one bath home located a half block from Carpinteria beach. Walkable to fabulous restaurants, shops and groceries - relax and unwind with everything you need. Laid out for easy entertaining, with concrete countertops in the kitche...
$375,000
$375,000
Available: Right Now
Exceptional ''pull-out'' opportunity for a buyer/user in Carpinteria's Sandpiper Village. The existing home is on a huge 5, 000+ sq. ft. lot with beautiful mountain views from the front and sprawling, private garden areas at the side/rear. Because of...
$2,4M
$2,4M
Available: Right Now
Experience both comfort and sophistication at this remarkable Carpinteria residence, where stunning mountain views await. Inside, an open floor plan boasts wood and tile flooring, luxurious tiles adorn the kitchen and bathrooms, while vaulted ceiling...

$495,000
$495,000
Available: Right Now
Located in Sandpiper Village, a beautifully maintained family park. The home features two bedrooms, two full baths. Living room is convenient to dining area and kitchen. A wonderful rear deck is adjacent to the primary bedroom. There is newer laminat...

$1,3M
$1,3M
Available: Right Now
Embrace a relaxed coastal lifestyle in the heart of Carpinteria. This cherished 3-bed, 2-bath home has been lovingly maintained and improved. The beautifully updated kitchen boasts handmade custom cabinets and a professional Italian range. Bright and...
Carpinteria
According to statistics, the population in Carpinteria, CA amounts to 13,593, which shows decline 0% compared to the previous year. The median age of the city’s residents is 43. The average household income is $69,834, shifting decline -4% from the past year, and the average property value in Carpinteria, CA growth 2% to $617,000 throughout the year.
| Population | 13,593 |
| Median Age | 43.4 |
| Poverty Rate | 8% |
| Household Income | $69,834 |
| Number Of Employees | 7,240 |
| Median Property Value | $617,000 |
Household Income
The average household income in Carpinteria, CA declined from $72,901 to $69,834 in the past year. This data is an estimate based upon 5,136 households in Carpinteria, CA . The chart below presents how household income is distributed in Carpinteria, CA in comparison to the revenue allocation amid households nationally.
Property Value
According to data from last year, the average property value in Carpinteria, CA shifted from $605,200 to $617,000 throughout the year. The subsequent graph indicates the share of properties in the given price range in Carpinteria, CA in comparison to the median property value in the same price segment across the country. According to the data, the greatest share of Carpinteria, CA properties falls in the '$500,000 to $749,999' range, which is higher than the most significant median property across the country.
Rent vs. Own
Property Taxes
One of the most important aspects for property owners is the amount of property taxes. This graph shows distribution of property taxes in Carpinteria, CA compared to median property taxes around the country. The prevalent amount of property taxes in Carpinteria, CA equals $3000, which is less than the national average.