Carrollton, MO 64633, USA apartments for sale

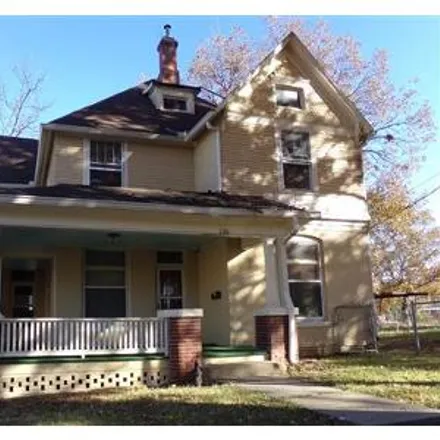
$129,900
$129,900
Available: Right Now
Are you looking for an investment property or are you looking for a large home at an affordable price? How about both? This versatile home offers the best of both worlds with its two separate living spaces, perfect for extended family, rental income,...

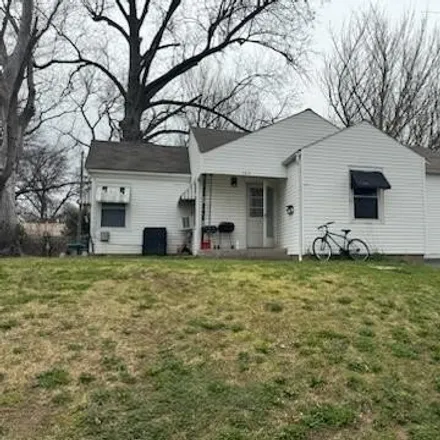
$160,000
$160,000
Available: Right Now
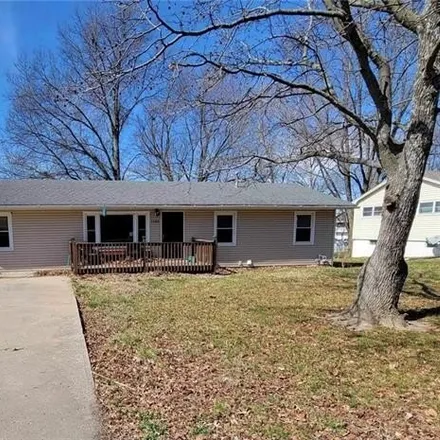
This freshly renovated 3 bed/1 stylish bath ranch home sits atop a full basement and under a new roof, soffits, facias, and gutters. With all new flooring, coupled with new modern appliances, refaced cabinets, and new countertops, you'll find a blend...
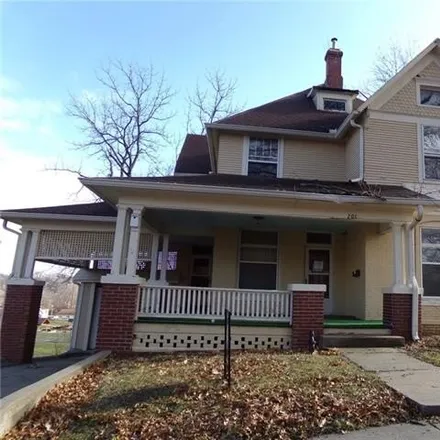
$76,500
$76,500
Available: Right Now
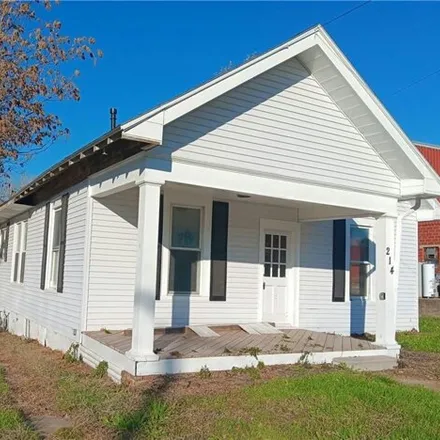
Take a look at this stately turn of the century home. Almost 2500 sq feet of living area including a nice sunroom off the kitchen. 3rd story could be finished for even more living area. Fenced yard, corner lot as well as interior amenitites such as n...
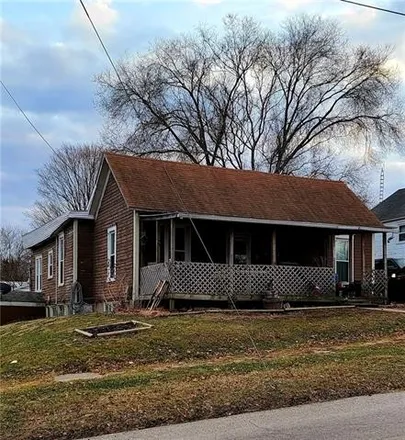
$80,000
$80,000
Available: Right Now
This Bungalow Features Four Bedroom and One Full Bath, Main Level Laundry, Master Bedroom Separated From The Other Three Rooms, Vinyl Siding, Big Lot, Shed. Investment Property With Tenant On A Long Term Lease And Wants To Stay Longer! Currently Rent...

$36,000
$36,000
Available: Right Now
One and a half story home with a beautiful double lot located in the heart of Carrollton. One bedroom downstairs with a loft bedroom upstairs. Kitchen plus a dining room. This home also has an unfinished basement. With a little TLC and imagination th...

$34,900
$34,900
Available: Right Now
This real estate listing is located in Carrollton, mo. The listed price is$34900.It is a 4 bedroom, 3 bathroom property. The property measures approximately 2445 square feet....
$59,900
$59,900
Available: Right Now
This real estate listing is located in Carrollton, mo. The listed price is$59900.It is a 5 bedroom, 1 bathroom property. The claimed lot size is 7841 square feet....
$30,000
$30,000
Available: Right Now
**Back on Market, NO FAULTof Seller!! Inspections and appraisal were completed.** Investment opportunity !! Bring Your Imagination And A Paint Brush And Make This Your New Home! Perfect for a starter home or as a rental property. Seller has ma...
$79,900
$79,900
Available: Right Now
This delightful 2-bedroom home with a partial basement and a 1-car detached garage is perfect for those seeking a cozy and functional living space. With a new kitchen, a gorgeously remodeled bathroom, and fresh paint and flooring throughout, don't mi...
$115,000
$115,000
Available: Right Now
Sitting on a humongous lot, this unique home offers plenty of space both inside and out! Generously sized bedrooms, 2 full baths with some modern updates, and a good sized kitchen that just needs a little bit of work! Full basement offers a great spa...
Carrollton
According to statistics, the population in Carrollton, MO amounts to 3,729, which shows decline -1% compared to the previous year. The median age of the city’s residents is 42. The average household income is $32,111, shifting growth 4% from the past year, and the average property value in Carrollton, MO growth 3% to $69,000 throughout the year.
What is the Average Price of Apartments for Sale in Carrollton, MO, 64633?
| Month | Median Price |
|---|---|
| Jun 2024 |
$253,223
|
| May 2024 |
$268,934
|
| Apr 2024 |
$280,842
|
| Mar 2024 |
$280,842
|
| Feb 2024 |
$280,842
|
| Jan 2024 |
$280,842
|
| Month | Median Price |
|---|---|
| Jun 2024 |
$446,339
|
| May 2024 |
$434,992
|
| Apr 2024 |
$439,598
|
| Mar 2024 |
$406,294
|
| Feb 2024 |
$406,294
|
| Jan 2024 |
$406,294
|
Household Income
The average household income in Carrollton, MO grew from $30,739 to $32,111 in the past year. This data is an estimate based upon 1,543 households in Carrollton, MO . The chart below presents how household income is distributed in Carrollton, MO in comparison to the revenue allocation amid households nationally.
Property Value
According to data from last year, the average property value in Carrollton, MO shifted from $67,000 to $69,000 throughout the year. The subsequent graph indicates the share of properties in the given price range in Carrollton, MO in comparison to the median property value in the same price segment across the country. According to the data, the greatest share of Carrollton, MO properties falls in the '$50,000 to $59,999' range, which is lower than the most significant median property across the country.
Property Taxes
One of the most important aspects for property owners is the amount of property taxes. This graph shows distribution of property taxes in Carrollton, MO compared to median property taxes around the country. The prevalent amount of property taxes in Carrollton, MO equals $800, which is less than the national average.