Castle, OK 74833, USA apartments for sale
$150,000
$150,000
Available: Right Now
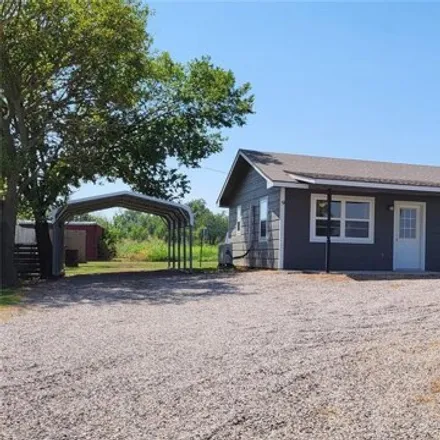
2 bed/1 bath newly built in 2021 adorable home on a little more than an acre! Home has been meticulously-maintained, has all the latest trends and modern colors in interior and exterior. The kitchen is a nice size with quite a few cabinets and tiled ...
Castle
According to statistics, the population in Castle, OK amounts to 161, which shows growth 3% compared to the previous year. The median age of the city’s residents is 32. The average household income is $35,833, shifting growth 2% from the past year, and the average property value in Castle, OK n/a% to $32,500 throughout the year.
Household Income
The average household income in Castle, OK grew from $35,156 to $35,833 in the past year. This data is an estimate based upon 50 households in Castle, OK . The chart below presents how household income is distributed in Castle, OK in comparison to the revenue allocation amid households nationally.
Property Value
According to data from last year, the average property value in Castle, OK shifted from $32,500 to $32,500 throughout the year. The subsequent graph indicates the share of properties in the given price range in Castle, OK in comparison to the median property value in the same price segment across the country. According to the data, the greatest share of Castle, OK properties falls in the '$50,000 to $59,999' range, which is lower than the most significant median property across the country.
Property Taxes
One of the most important aspects for property owners is the amount of property taxes. This graph shows distribution of property taxes in Castle, OK compared to median property taxes around the country. The prevalent amount of property taxes in Castle, OK equals $800, which is less than the national average.