Cayucos, CA 93430, USA apartments for sale
$1,58M
$1,58M
Available: Right Now
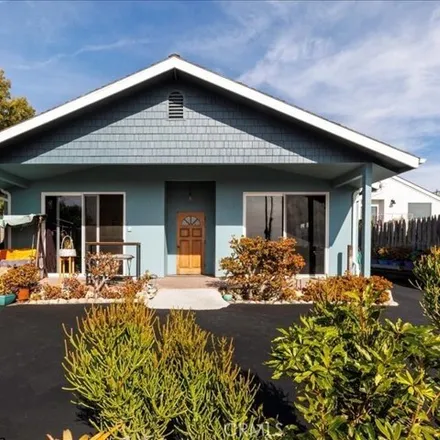
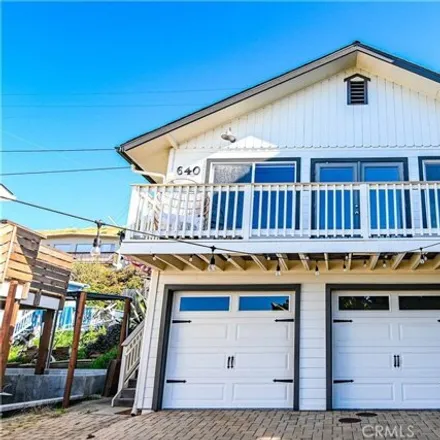
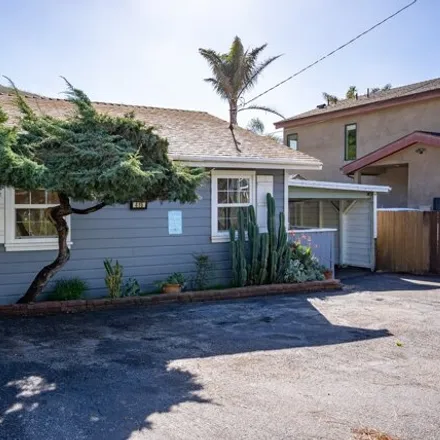
Steps to sand, surf and ocean. Idyllic single-level beach cottage in a great location. Arise in the morning to stroll to Cayucos Pier and along the beach. Built in 2002, the property shows well and is like new. Three bedrooms, two baths and a two-car...
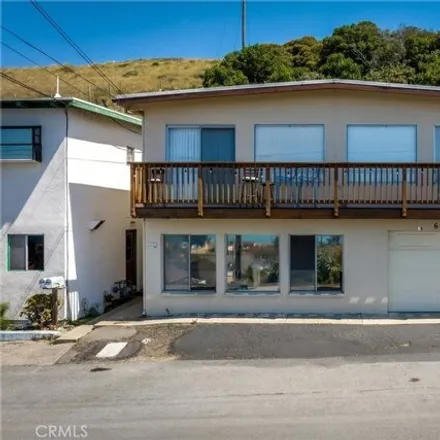
$1,78M
$1,78M
Available: Right Now
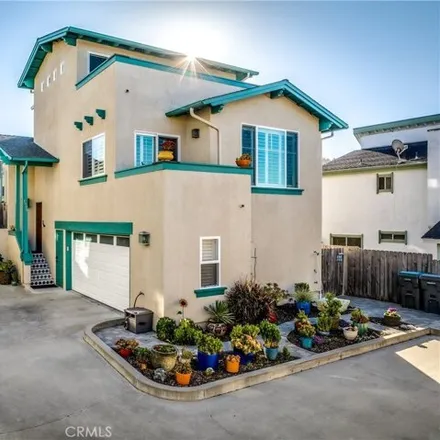
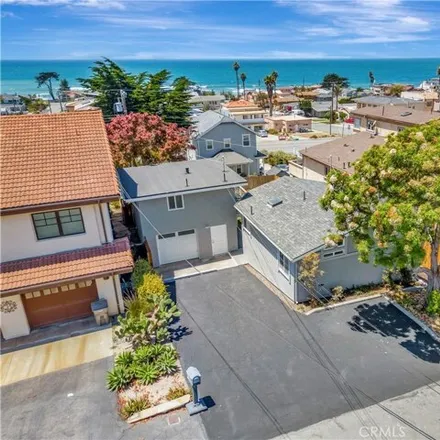
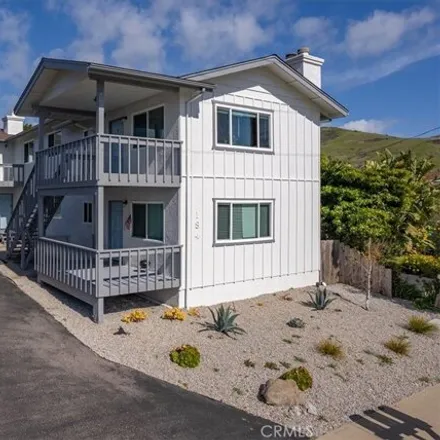
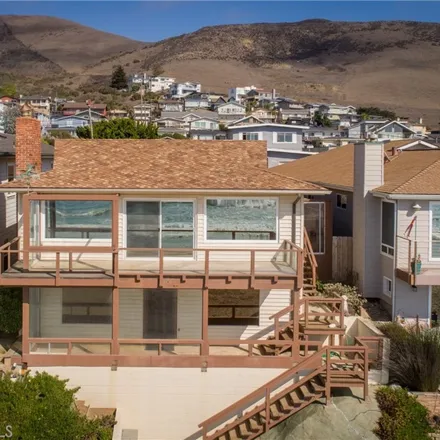
Rare vistas with four elevated decks, accent a quiet location with significant elevation offering fine views of the ocean and beautiful surrounding hills. The site is two blocks from the beach and walkable to downtown Cayucos. This home sits on the u...

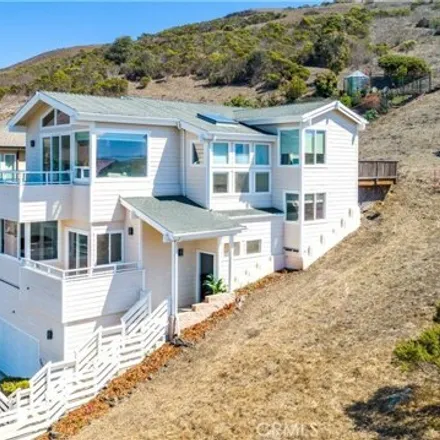
$2,95M
$2,95M
Available: Right Now
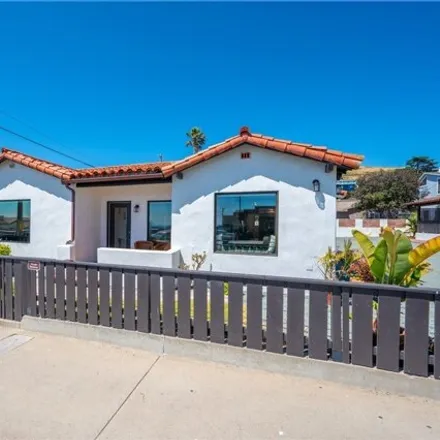
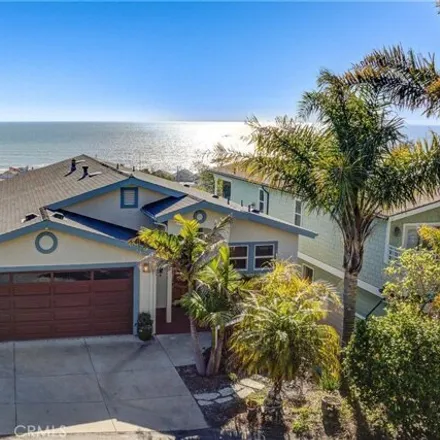
This charming Cayucos residence offers a quintessential Californian beach lifestyle with breathtaking ocean views and coastal breezes. Situated on Pacific Avenue, this home blends comfort, style, and tranquility. As you step inside, you are greeted w...

$1,15M
$1,15M
Available: Right Now
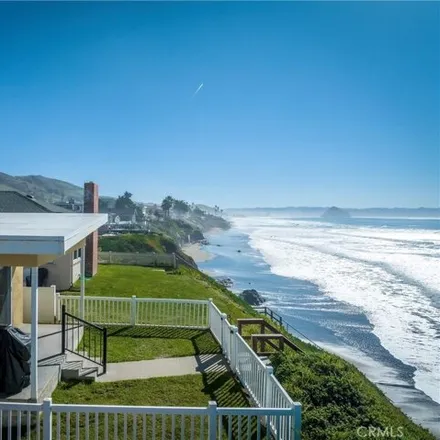
Coastal vibes and countryside charm in this impeccably remodeled Cayucos Beach House with a Vacation Rental License. The home boasts a spacious open-concept layout, with a kitchen that's been redesigned for both style and functionality, featuring bra...

$2,35M
$2,35M
Available: Right Now
Incredible beachside Coastal Craftsman with Ocean views nestled in the beloved numbered streets of Cayucos! Breath easy and recharge here, just a short walk to miles of sandy beach and frolicking pacific. No shortage of charm and allure as the calm c...
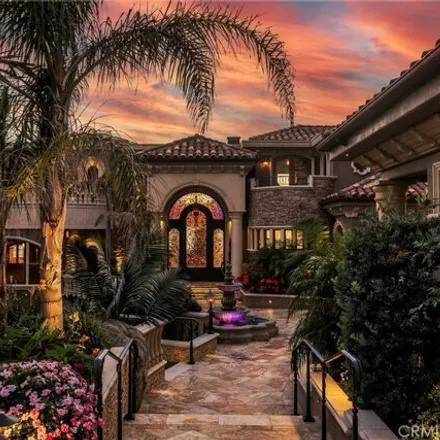
$5,8M
$5,8M
Available: Right Now
Legacy, Opportunity, and Functionality; a Spanish Mediterranean style property that has it all. Zoned commercial, residential, and hospitality, the possibilities are rich. Situated a block from the heart of beautiful downtown Cayucos, this prime corn...
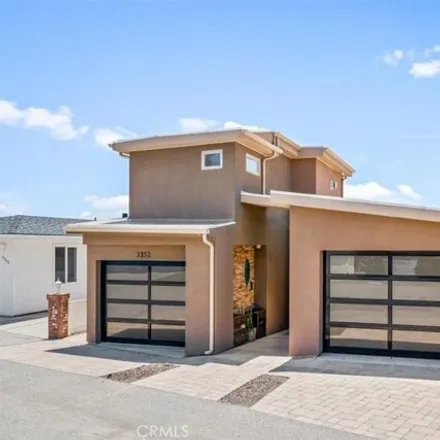
$2,9M
$2,9M
Available: Right Now
A slender parcel of ample depth boasts a clever design! Window placements deliver a bright ambiance with sweeping views of the Cayucos coastline from Piedras Blancas to Pt. Buchon, plus accents from Irish Hills to Morro Rock. Upgrades include paint, ...
$1,25M
$1,25M
Available: Right Now
Views and Versatility Abound in this Cayucos In Town hillside structure tucked below the higher ground. The two story plan features an upper level unit reached via upgraded stairs. A generously sized living, dining, kitchen area serves up spectacular...

$1,38M
$1,38M
Available: Right Now
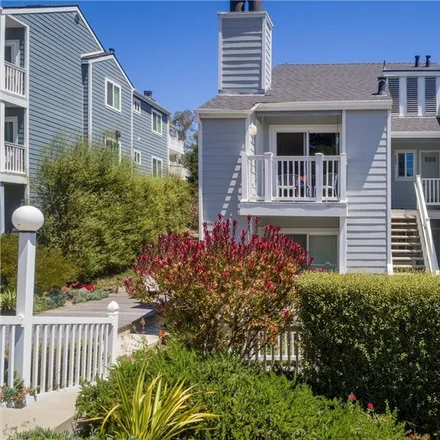
Bright Balance! This end unit Lucerne condo offers fine ocean views, proximity to the historic downtown area with its beaches, pier, and stores, plus it enjoys easy parking while capturing that small beach town feel even in Summer months. The plan fe...
$2M
$2M
Available: Right Now
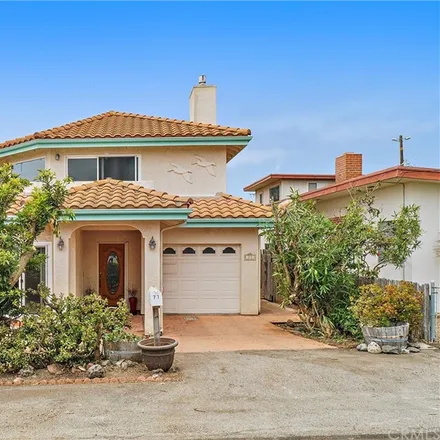
Welcome to Cayucos-by-the-Sea! Don't miss the opportunity to own this fabulous home, which is beautifully designed with custom Architectural style, built by a Civil Engineer to his exact standards. The smaller sister to this lovely home just SOLD for...
$12,8M
$12,8M
Available: Right Now
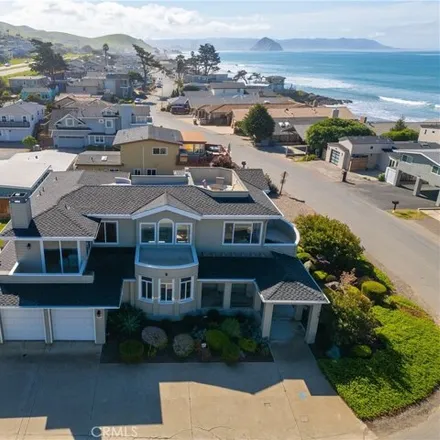
Striking residence on a prime10, 000+ sq ft oceanfront parcel with landscaping that includes waterfalls, terraces, fire pit, rock work and outside fireplace. There's an oversized 2-car garage with bonus room above, plus an extra off-street parking sp...
$4,75M
$4,75M
Available: Right Now
This ocean front custom home was completely remodeled in 2017 with detail to quality, fine finishes and comfort. There are three bedrooms and three bathrooms, including two primary suites. The downstairs primary suite has a gas fireplace between the ...
$2,29M
$2,29M
Available: Right Now
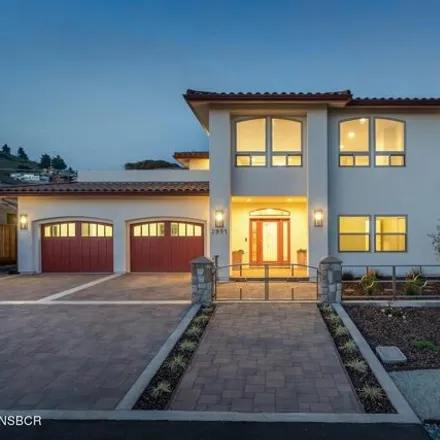
Newly constructed masterpiece embodies timeless elegance w/ breathtaking vistas of the boundless ocean. 4/ 3.5bath. A grand entrance awaits w/ an oversized Therma Tru(r) front door, setting the tone for the home's remarkable design. A welcoming foyer...

$1,3M
$1,3M
Available: Right Now
Ocean view vacation Beach House in Old Cayucos, considered by many to be one of the last unspoiled beach towns along the California coast. Enjoy whale watching, breathtaking sunsets and the Cayucos 4th of July fireworks from your ocean view deck. Thi...
$1,4M
$1,4M
Available: Right Now
Two fantastic ocean view homes on one lot! Come see these amazing remodeled and updated homes in captivating Cayucos! Live the beach life in style! Not often do you find two homes on one large ocean view property in Cayucos. Both homes have be...
$2,65M
$2,65M
Available: Right Now
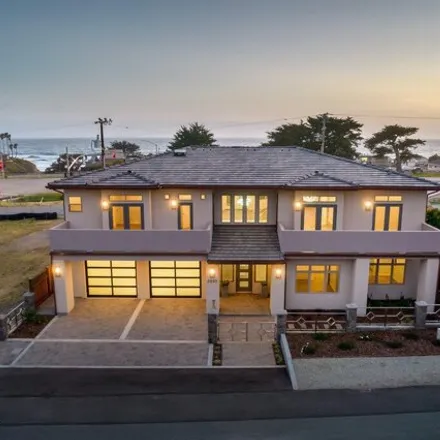
Experience contemporary coastal living within this custom 4 bed/ 3.5 bath home. Drawing you in with its striking design, the property showcases captivating curb appeal, illuminated by recessed outdoor lighting, eco-friendly landscaping, and a chic Th...
$2,5M
$2,5M
Available: Right Now
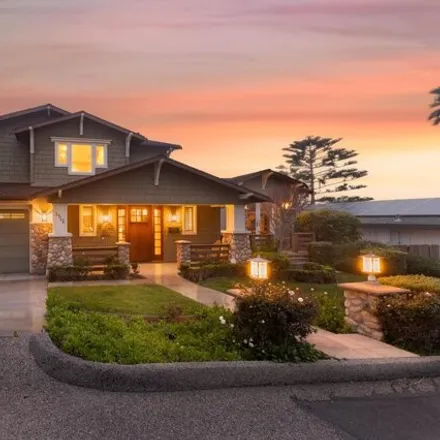
Welcome to the Orrick Cottage built by William Hezmalhalch Architects, AIA. The Singular Silhouette craftsman theme shows throughout the home in every detail. This spacious residence is located on a hillside parcel with panoramic views of both Morro ...
$1,38M
$1,38M
Available: Right Now
Nestled on the west side of Hwy 1 near downtown Cayucos and a few short blocks to the beach, this updated coastal home is move-in ready and offers flexible layout options as a 3BD home or a 2BD home with separate living studio. Upstairs youll find an...

$2M
$2M
Available: Right Now
An artistic mix of vivid ocean views and a versatile plan that showcases space and light make this residence unique. The front elevation features stylish relief, expansive windows and multiple decks. Nicely integrated stairs lead to a stately level t...
$2,2M
$2,2M
Available: Right Now
One of a kind Tri-Plex located three blocks from the Cayucos Pier. The property is currently being rented on annual leases, however the current owner does have a vacation rental license for the whole property. Each unit has been completely renovated....
$725,000
$725,000
Available: Right Now
Here is the opportunity that you have been waiting for! This two-bedroom, one-bath, end unit condo is the perfect opportunity to soak up all that Cayucos has to offer. The inviting landscaping welcomes you to this upper front unit with its own entry ...
$3M
$3M
Available: Right Now
Introducing your dream coastal escape nestled on Studio Drive in the charming town of Cayucos! This remarkable 2784 sqft 3-bedroom, 3-bathroom haven occupies one of two legal parcels, offering an exquisite fusion of tranquility, opulence, and sweepin...
$2,8M
$2,8M
Available: Right Now
Welcome to 1010 Saint Mary Street, your coastal retreat in the heart of Cayucos. Situated on a tranquil street, this stunning home offers unparalleled panoramic views stretching from Morro Rock to the Cayucos Pier, providing an awe-inspiring backdrop...
$3,5M
$3,5M
Available: Right Now
Forever views await you @ 3510 Studio Drive, Cayucos. Unending whitewater views, gorgeous sunrises or sunsets, and a great spot for surfers, the beachfront property offers about2, 245sq. ft., featuring 3 bedrooms, 3 baths, and a rare 2-car garage wit...

$2,35M
$2,35M
Available: Right Now
Incredible beachside Coastal Craftsman with Ocean views nestled in the beloved numbered streets of Cayucos! Breath easy and recharge here, just a short walk to miles of sandy beach and frolicking pacific. No shortage of charm and allure as the calm c...
$1,6M
$1,6M
Available: Right Now
Desirable numbered street property in Cayucos within a block to beach, sand and sea, and conveniently close to South Ocean Avenue for a walk to shops, restaurants, and the pier or easy access to Cabrillo Highway One. 3 bedrooms including the master e...

$3,43M
$3,43M
Available: Right Now
Dream Weaver! Oceanfront houses of Cayucos are fantasies to many who seek the rare charm of a picturesque beach town nestled on a very special coastline. This Licensed vacation rental offers classic design elements like open beamed ceilings, used bri...
$895,000
$895,000
Available: Right Now
Rare multi-unit property in Cayucos. The main home, an attractive 2-bedroom, 1-bathroom residence, offers an ocean view, complemented by an abundance of natural light flowing in from a skylight and plentiful windows in the kitchen. A second unit with...
$1,03M
$1,03M
Available: Right Now
Don't miss this rare opportunity to own an oceanfront Cayucos condo! Located downtown with easy access to the shops, restaurants and steps away from the beach. The entry level has 2 bedrooms and 1 full bath. Upstairs features the kitchen which opens ...
Cayucos
According to statistics, the population in Cayucos, CA amounts to 2,847, which shows decline -5% compared to the previous year. The median age of the city’s residents is 56. The average household income is $61,226, shifting growth 5% from the past year, and the average property value in Cayucos, CA growth 5% to $720,900 throughout the year.
Household Income
The average household income in Cayucos, CA grew from $58,365 to $61,226 in the past year. This data is an estimate based upon 1,395 households in Cayucos, CA . The chart below presents how household income is distributed in Cayucos, CA in comparison to the revenue allocation amid households nationally.
Property Value
According to data from last year, the average property value in Cayucos, CA shifted from $685,900 to $720,900 throughout the year. The subsequent graph indicates the share of properties in the given price range in Cayucos, CA in comparison to the median property value in the same price segment across the country. According to the data, the greatest share of Cayucos, CA properties falls in the '$500,000 to $749,999' range, which is higher than the most significant median property across the country.
Property Taxes
One of the most important aspects for property owners is the amount of property taxes. This graph shows distribution of property taxes in Cayucos, CA compared to median property taxes around the country. The prevalent amount of property taxes in Cayucos, CA equals $3000, which is less than the national average.