Cayuga, IN 47928, USA apartments for sale
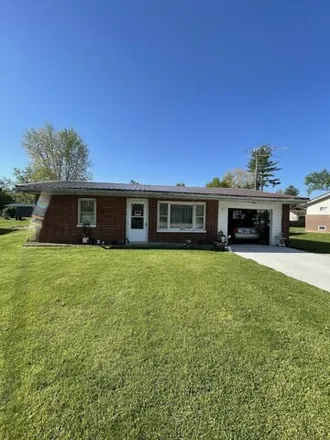
$139,000
$139,000
Available: Right Now
Come see this brick ranch in Cayuga! It has 1 attached garage and a very large detached garage that is insulated and finished construction in 2006.lots of storage in the new garage! This would be the perfect starter home for a family or a single pers...

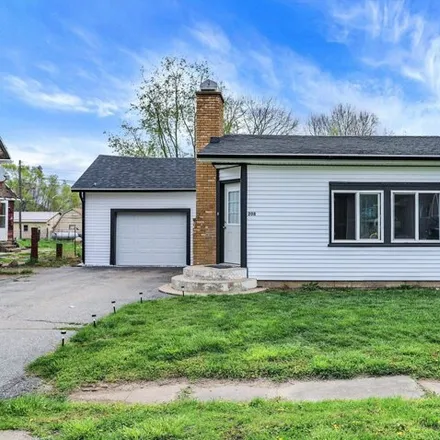
$176,500
$176,500
Available: Right Now
Checkout this Move in ready, newly renovated 3 bedroom 2 full bath home located in Cayuga, IN. Renovations include; New electrical throughout, new plumbing, new waterline to the main, all new light fixtures, new kitchen cabinets and both bathr...
$100,000
$100,000
Available: Right Now
A lovely 2-bedroom home in Cayuga boasting recent updates throughout. Enjoy the warmth of a fireplace in the living room and the convenience of a spacious backyard. This cozy home showcases new roofing (6 months), siding, and insulation, ensuring com...
Cayuga
According to statistics, the population in Cayuga, IN amounts to 1,179, which shows growth 4% compared to the previous year. The median age of the city’s residents is 41. The average household income is $48,333, shifting decline -3% from the past year, and the average property value in Cayuga, IN decline -2% to $67,600 throughout the year.
Household Income
The average household income in Cayuga, IN declined from $50,000 to $48,333 in the past year. This data is an estimate based upon 474 households in Cayuga, IN . The chart below presents how household income is distributed in Cayuga, IN in comparison to the revenue allocation amid households nationally.
Property Value
According to data from last year, the average property value in Cayuga, IN shifted from $68,800 to $67,600 throughout the year. The subsequent graph indicates the share of properties in the given price range in Cayuga, IN in comparison to the median property value in the same price segment across the country. According to the data, the greatest share of Cayuga, IN properties falls in the '$70,000 to $79,999' range, which is lower than the most significant median property across the country.
Property Taxes
One of the most important aspects for property owners is the amount of property taxes. This graph shows distribution of property taxes in Cayuga, IN compared to median property taxes around the country. The prevalent amount of property taxes in Cayuga, IN equals $800, which is less than the national average.