Chalfant, PA 15112, USA apartments for sale
$79,995
$79,995
Available: Right Now
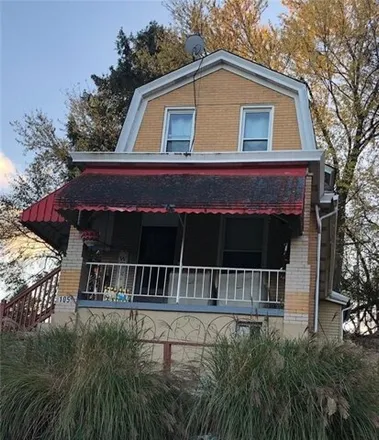
Welcome to 105 Peter Street in Wilkins Township!! Move-in ready !! Find here, a lovely home that offers peace and privacy. With huge rooms, layout your living spaces and bedrooms, just the way you desire. Enjoy cooking in the kitchen, where yo...
$199,000
$199,000
Available: Right Now
$45,000
$45,000
Available: Right Now
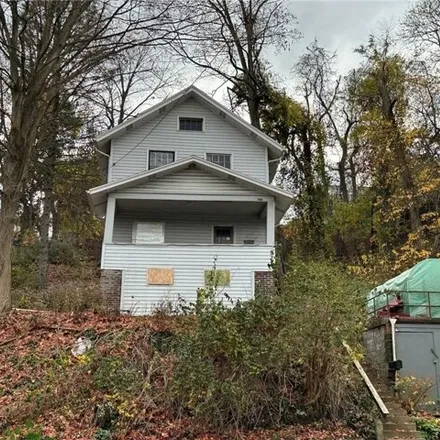
Investor special !!! Great potential with strong bones, hardwood floors (painted), tall ceilings, ceiling fans, large size rooms, and a new roof. A great home to live in, rent out, fix and flip, or add to your investment portfolio....
$199,900
$199,900
Available: Right Now
$179,900
$179,900
Available: Right Now
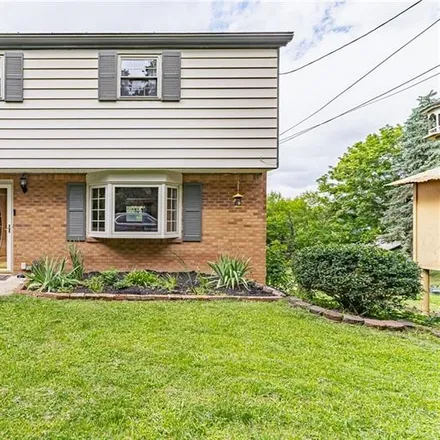
Welcome to 116 LeGrande! This home has been lovingly cared for by the previous owner for years and is ready for new owners. Fresh paint, recently uncovered hardwood flooring and a tiled bathroom make this home a gem of one-level living. Bedrooms are ...
Chalfant
According to statistics, the population in Chalfant, PA amounts to 773, which shows decline -3% compared to the previous year. The median age of the city’s residents is 45. The average household income is $41,500, shifting decline -7% from the past year, and the average property value in Chalfant, PA decline 0% to $76,400 throughout the year.
Household Income
The average household income in Chalfant, PA declined from $44,659 to $41,500 in the past year. This data is an estimate based upon 388 households in Chalfant, PA . The chart below presents how household income is distributed in Chalfant, PA in comparison to the revenue allocation amid households nationally.
Property Value
According to data from last year, the average property value in Chalfant, PA shifted from $76,500 to $76,400 throughout the year. The subsequent graph indicates the share of properties in the given price range in Chalfant, PA in comparison to the median property value in the same price segment across the country. According to the data, the greatest share of Chalfant, PA properties falls in the '$80,000 to $89,999' range, which is lower than the most significant median property across the country.
Property Taxes
One of the most important aspects for property owners is the amount of property taxes. This graph shows distribution of property taxes in Chalfant, PA compared to median property taxes around the country. The prevalent amount of property taxes in Chalfant, PA equals $2500, which is less than the national average.