Clayton, AL 36016, USA apartments for sale
$65,900
$65,900
Available: Right Now
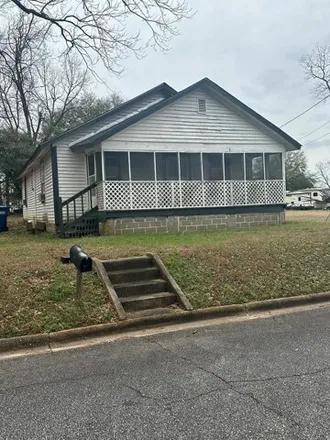
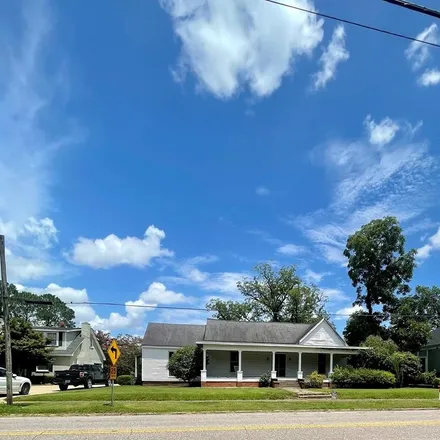
One level rural style farm house in Clayton.Al. This location would be ideal for the hunter or fisherman looking for an inexpensive spot to call a weekend place or a great starter home. Great investment property. Features a full screened porch, Wood ...
$110,000
$110,000
Available: Right Now
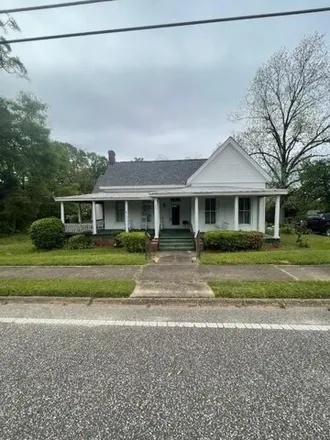
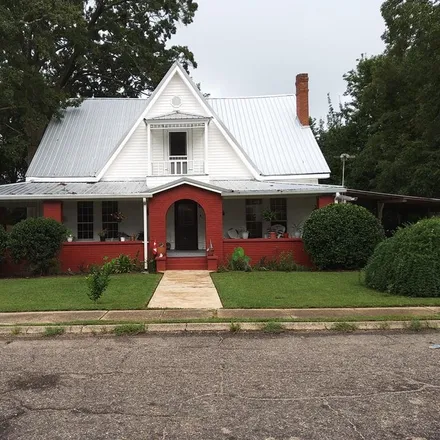
Step into the charm of yesteryears with this historic 3-bedroom, 1 1/2-bathroom home nestled in the serene rural beauty of Clayton, AL. Built with enduring craftsmanship and steeped in stories of generations past, this home offers a unique blend of c...
$225,000
$225,000
Available: Right Now
Perfect house for a family seeking quiet town living and having a garden and possibly chickens. 2 [email protected] ac, 3BR, 2BA,huge den w/wood FP, formal LivandDR, lg laundryRM, renovated kit/w SS appliances, center isle w/granite counters, gas stoveTop w/...

$175,000
$175,000
Available: Right Now
Nestled in the charming and historic town of Clayton, Alabama, this adorable two-level home seamlessly combines some modern amenities with timeless elegance. Offering 4 bedrooms, 3 baths, and a versatile bonus space, this residence is perfect for fam...

$75,000
$75,000
Available: Right Now
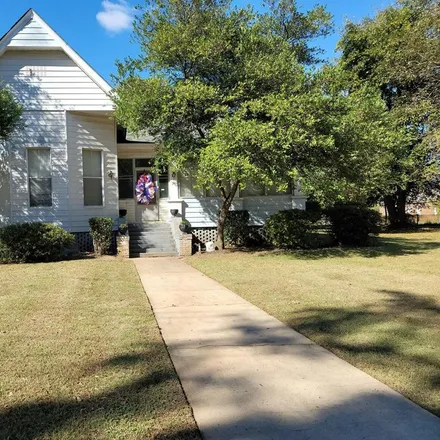
Located in the heart of Downtown Clayton, Alabama, this charming 1930s home sits on a 0.27-acre shaded lot in a close-knit neighborhood. With1, 169square feet of living space, it features 2 bedrooms, 1 bathroom, and a versatile flex room perfect for ...
$125,000
$125,000
Available: Right Now
This home has so much room, 4 exceptionally large bedrooms. The Master-bed room does not have a closet, but one can be added easily. Large laundry room. Dining room has been remodeled, with Beautiful textured walls and new floor. Bedrooms have built-...
$60,000
$60,000
Available: Right Now
This Historic Victorian home circa late 1800's is ready to be brought back to life! This 3272 sq. foot 5 Bedroom, 2 Bath home has wood floors throughout, a FP in just about every room, large front & side porches, & high ceilings. The previous owner s...
$84,500
$84,500
Available: Right Now
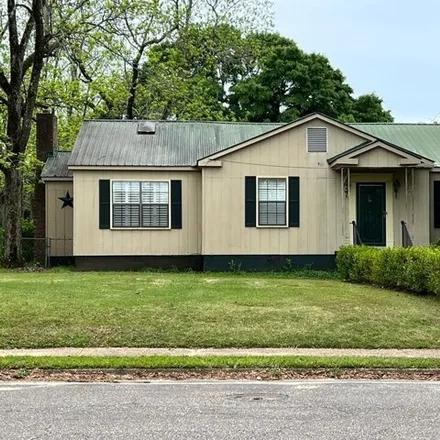
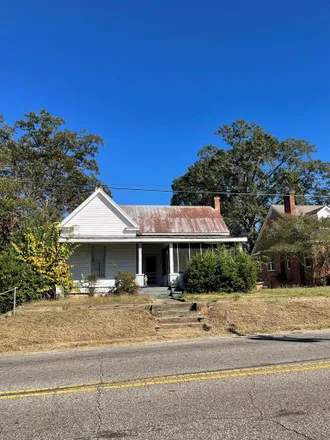
This 3 Bedroom 2 Bath historic 1900's single level home is just waiting for your very own upgrades throughout. The previous owner has done some painting, installed vinyl exterior siding, and kept up the established landscaping. This home has so much ...
$84,500
$84,500
Available: Right Now
This 3 Bedroom, 2 Bath historic 1900's single level home is just waiting for your very own upgrades throughout. This home is located along N. Midway Street in historic Clayton, AL. Offering spacious rooms, original wood floors, two living areas and a...
$855,000
$855,000
Available: Right Now
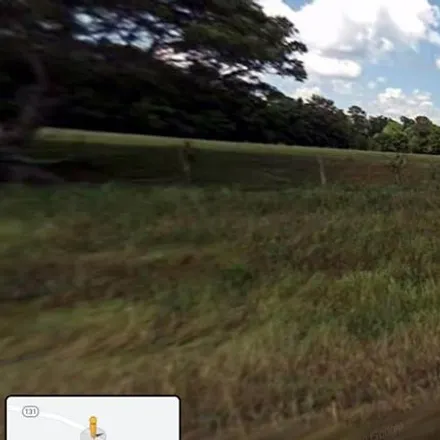
Approx. 342 acres frontingSR 131,Barbour County , AL. Approx. 185 acres in cultivation with 181.5 base peanut acreage with an income of$23, 000.in crop year 2021 includes land rent. 3 nice stocked fish ponds with bass and shellcracker. East Fork of C...
$39,900
$39,900
Available: Right Now
This circa 1910 era 1592 sq. foot home sits on 1.1 acres in downtown Clayton, AL. This home is being sold "as is" and would be perfect for a family looking for a project! This home has 3 BR's, 2 Bath's, tall ceilings, spacious bedrooms, large front p...
$261,000
$261,000
Available: Right Now
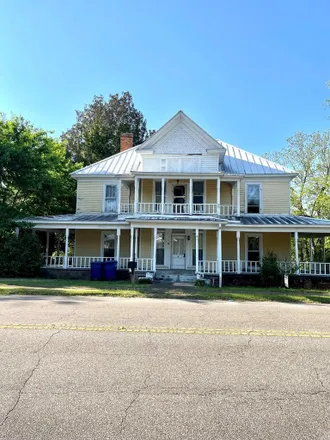
This beautiful 1870s home is a host of beauty and majestic grace. The manicured yard is trimmed with a newly installed privacy fence. A large wrap around porch circles the home inviting guest to enjoy the outdoors or to enter. As this home was once u...
$39,900
$39,900
Available: Right Now
This circa 1910 era 1592 square foot home is situated on 1.1 acres in beautiful, downtown Clayton, AL. This home is being sold "as is" and would be the perfect property for a family looking for a renovation project! This home has 3 bedrooms, 2 baths,...
Clayton
According to statistics, the population in Clayton, AL amounts to 2,912, which shows decline -1% compared to the previous year. The median age of the city’s residents is 37. The average household income is $24,643, shifting decline -3% from the past year, and the average property value in Clayton, AL decline -3% to $75,800 throughout the year.
What is the Average Price of Apartments for Sale in Clayton, AL, 36016?
| Month | Median Price |
|---|---|
| Jun 2024 |
$403,759
|
| May 2024 |
$327,748
|
| Apr 2024 |
$343,342
|
| Mar 2024 |
$343,342
|
| Feb 2024 |
$343,342
|
| Jan 2024 |
$343,342
|
| Month | Median Price |
|---|---|
| Jun 2024 |
$466,408
|
| May 2024 |
$465,178
|
| Apr 2024 |
$470,138
|
| Mar 2024 |
$470,138
|
| Feb 2024 |
$470,138
|
| Jan 2024 |
$470,138
|
Household Income
The average household income in Clayton, AL declined from $25,352 to $24,643 in the past year. This data is an estimate based upon 522 households in Clayton, AL . The chart below presents how household income is distributed in Clayton, AL in comparison to the revenue allocation amid households nationally.
Property Value
According to data from last year, the average property value in Clayton, AL shifted from $78,100 to $75,800 throughout the year. The subsequent graph indicates the share of properties in the given price range in Clayton, AL in comparison to the median property value in the same price segment across the country. According to the data, the greatest share of Clayton, AL properties falls in the '$50,000 to $59,999' range, which is higher than the most significant median property across the country.
Property Taxes
One of the most important aspects for property owners is the amount of property taxes. This graph shows distribution of property taxes in Clayton, AL compared to median property taxes around the country. The prevalent amount of property taxes in Clayton, AL equals $800, which is less than the national average.