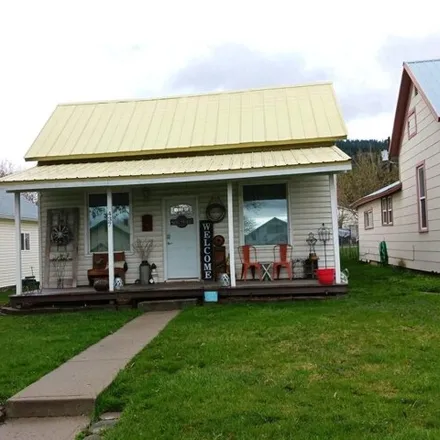
Colville, WA 99114, USA apartments for sale

$189,000
$189,000
Available: Right Now
Welcome to this cozy and efficiently designed home, situated within walking distance to shopping amenities. This property makes excellent use of every inch, featuring a separate laundry room with an attached small room that can serve as a closet, hob...

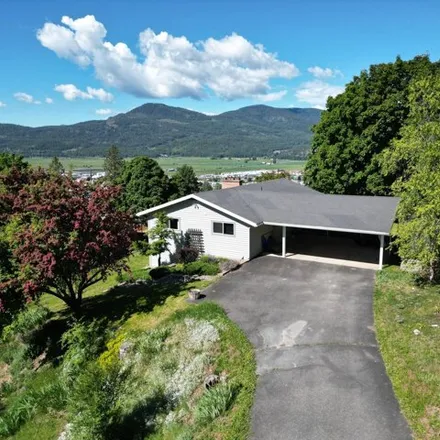
$270,000
$270,000
Available: Right Now
Don't overlook this rancher home in Colville, boasting over 1300 square feet all on one level. It offers 3 bedrooms and 1 bathroom, featuring a custom-tiled spacious walk-in shower. Enjoy the sizable deck with a gazebo, along with a single-car detach...

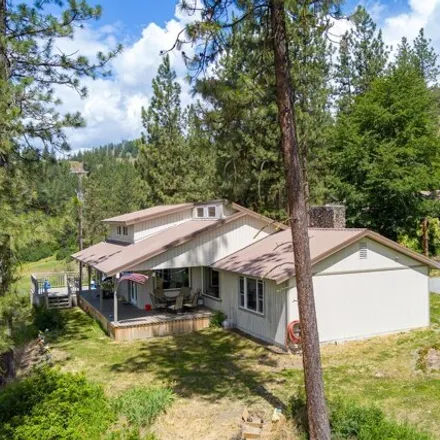
$260,000
$260,000
Available: Right Now
Charming one level living home, Neat and Clean and Ready to Move into, Nice and Bright Rooms, 3 Bedrooms 1.2 Bath, Updated Kitchen, Stainless Steel Appliances, Dishwasher, Laminate Flooring, recently remodeled Bathroom, Spacious Living Room w/...

$799,000
$799,000
Available: Right Now
Want to live next to your business or create multiple streams of income? Look no further! Here's your opportunity to own a 2-bedroom house with a 912 square foot flex space storage adjacent to commercial property in the heart of Colville. The home, z...

$335,000
$335,000
Available: Right Now
Charming 1.5 story traditional Tudor home with detached two car garage and plenty of off street parking situated on a corner lot. The main floor boasts an inviting living room with a floor to ceiling masonry fireplace, large adjacent dining room, ado...

$520,000
$520,000
Available: Right Now
Nestled on 4.5 acres with stunning views overlooking Colville Valley, this beautifully renovated 3-bedroom, 3-bath, 2000 sq ft home offers the perfect blend of country living and convenience, being just one mile from Colville. The property features a...
$260,000
$260,000
Available: Right Now
Charming cottage style 2 bedroom home with updated kitchen and bathroom offers stylish comfortable lifestyle with lots of character and charm. Newer gas furnace and energy efficient windows to keep you warm in the winter. Covered front porch offers n...

$325,000
$325,000
Available: Right Now
This delightful 3-bedroom, 1.5 bathroom home boasts instant charm and functionality. Located in a desirable neighborhood with excellent curb appeal, this house is move-in ready and waiting for you to make it your own. Step inside and be greeted by th...

$465,000
$465,000
Available: Right Now
Welcome to this charming 3 bedroom 1 bathroom mid-century home, conveniently located just one mile from downtown Colville. This property includes two parcels and sits on just shy of an acre, giving both privacy and room for hobbies and play. You'll e...
$435,000
$435,000
Available: Right Now
This beautiful 4 bed/2.5 bath home is situated on a.28 acre lot overlooking the town of Colville. This home boasts around2, 600sq ft of living space spread across two levels and has plenty of room to entertain. The kitchen was recently renovated and ...
$520,000
$520,000
Available: Right Now
Nestled on 4.5 acres with stunning views overlooking Colville Valley, this beautifully renovated 3-bedroom, 3-bath, 2000 sq ft home offers the perfect blend of country living and convenience, being just one mile from Colville. The property features a...

$310,000
$310,000
Available: Right Now
Extremely clean Marlette manufactured home in Colville! Situated on a nice corner lot, this property offers 3 beds, 2 baths, and1, 188sqft! Nice living room and kitchen give the home that open feel and easy access to the completely fenced backyard! L...

$449,900
$449,900
Available: Right Now
Wonderfully maintained home situated in the heart of Colville within walking distance of everything you could need. This classic 1925 home has been wonderfully updated and offers 2bdrms/1bth plus large den/study on the main floor, additional 2bdrms/1...

$310,000
$310,000
Available: Right Now
Check this Charming Home out walking distance to a school. This 3 bedroom, 2 bath home has been completely repainted and new flooring throughout. This home's Kitchen has been remodeled with beautiful Corian counter tops with backsplash, all new appli...
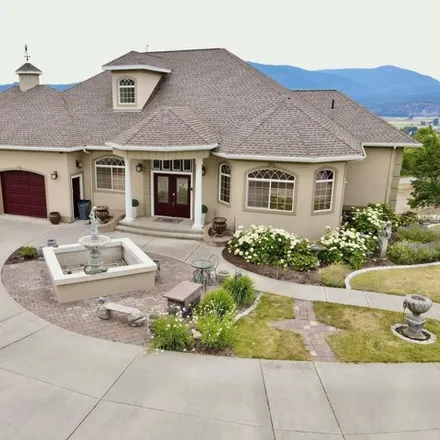
$850,000
$850,000
Available: Right Now
Luxury awaits in this sprawling estate with panoramic city, valley, and mountian views! Complete with a home gym, movie theatre, spa room, and walk in sauna. Primary suite boasts a Roman soaking tub, walk in shower, dual vanities, and dressing room. ...

$169,000
$169,000
Available: Right Now
Opportunity comes knocking! Whether you are a in the market for a home to reside in or an investor looking for a turn key rental, take a look at what this has to offer! This one story- 2-bedroom house is centrally located and has street or alley acce...

$695,000
$695,000
Available: Right Now
This charming remodeled 6-plex is centrally located in the town of Colville with views from the property of the surrounding mountains. Features include 5-one bedroom, one bath units and 1-2 bedroom, 1 bath unit with a community yard and patio for tho...

$799,000
$799,000
Available: Right Now
Looking for a prime commercial property in the heart of Colville? This is your chance to own not just one, but two properties! The centerpiece is the3, 621sq ft commercial property at 576 N Wynne, which boasts excellent traffic exposure, a paved park...

$350,000
$350,000
Available: Right Now
Enjoy an updated, open concept home located in the heart of Colville! This house offers 4 bedrooms, 2 full bathrooms and a full basement! The large, fenced yard has ample amount of space and potential for your enjoyment with 2 metal sheds that will r...

$825,000
$825,000
Available: Right Now
This turn of the century three story Multi family apartment building features 7 units and is situated in the heart of Colville. With it's stunning mountain, city and park views it's the perfect place for tenants to call home. Apartment sets back off ...

$390,000
$390,000
Available: Right Now
Great income property ! This Solid two bedroom 1 bathroom 2080 square foot home comes with a separate one bedroom and bath cottage. Easy access, parking on 3rd street or parking in the back of home. Nice year around creek in the front, large K...
$449,000
$449,000
Available: Right Now
Welcome HOME! This Colville home has been recently renovated inside and out. Sitting high on a corner lot, this home boasts a multitude of tasteful upgrades and improvements. New flooring, windows, stainless steel appliances, concrete countertops, fa...
Colville
According to statistics, the population in Colville, WA amounts to 4,697, which shows decline -1% compared to the previous year. The median age of the city’s residents is 43. The average household income is $37,462, shifting decline 0% from the past year, and the average property value in Colville, WA growth 3% to $156,500 throughout the year.
Household Income
The average household income in Colville, WA grew from $37,350 to $37,462 in the past year. This data is an estimate based upon 2,073 households in Colville, WA . The chart below presents how household income is distributed in Colville, WA in comparison to the revenue allocation amid households nationally.
Property Value
According to data from last year, the average property value in Colville, WA shifted from $151,400 to $156,500 throughout the year. The subsequent graph indicates the share of properties in the given price range in Colville, WA in comparison to the median property value in the same price segment across the country. According to the data, the greatest share of Colville, WA properties falls in the '$150,000 to $174,999' range, which is lower than the most significant median property across the country.
Property Taxes
One of the most important aspects for property owners is the amount of property taxes. This graph shows distribution of property taxes in Colville, WA compared to median property taxes around the country. The prevalent amount of property taxes in Colville, WA equals $1150, which is less than the national average.