Dixon, IL 61021, USA apartments for sale
$85,000
$85,000
Available: Right Now
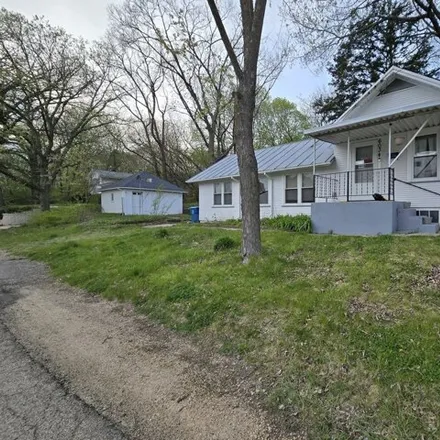
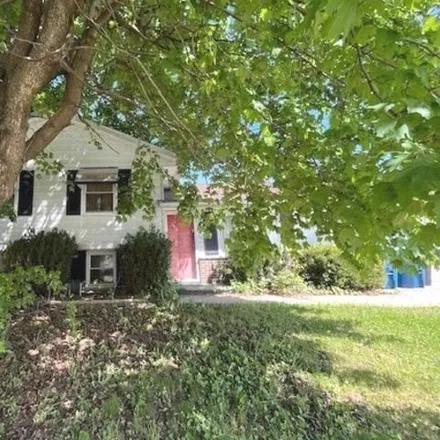
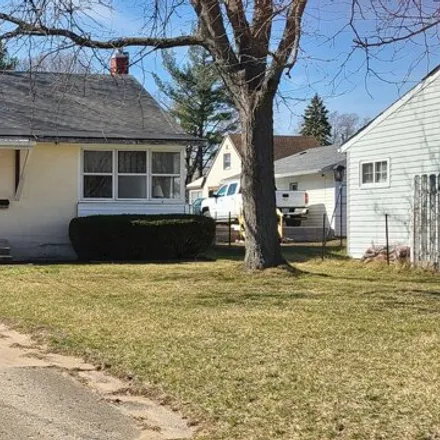
Super cute in a wonderful location. Corner lot with a nice patio area. Craft room off of the bedroom has a separate entrance and a wall heater. Vinyl windows and a steel roof, Whole house attic fan. 1 car garage door is currently enclosed but could b...
$215,000
$215,000
Available: Right Now
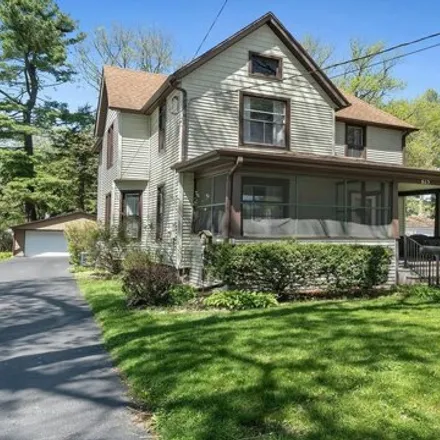
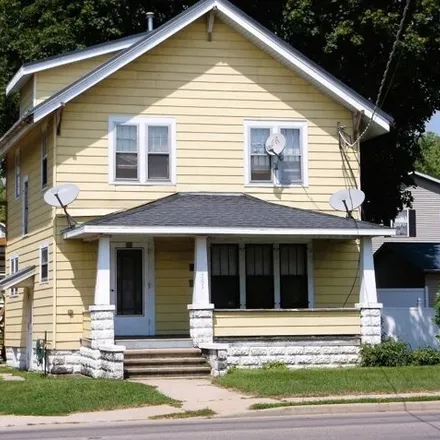
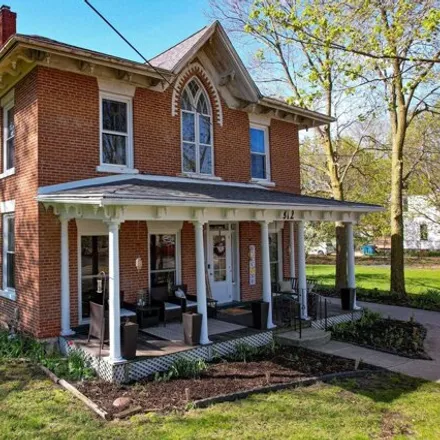
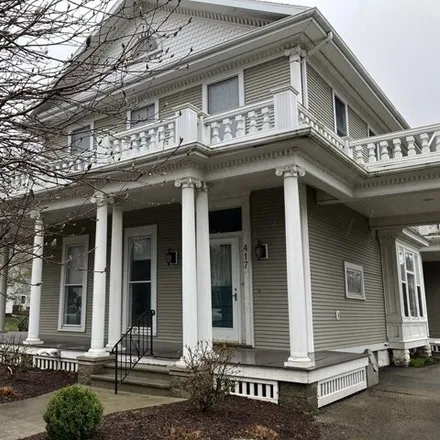
Gorgeous is an understatement! This grand 4 bedroom 2 bath home has beautiful original woodwork and pocket doors. Main floor of the home boasts a living room, family room, and dining room with 9 foot ceilings and hardwood floors. The mudroom with upd...
$600,000
$600,000
Available: Right Now
Business opportunity awaits ! Great location at the cul-de-sac where S Peoria Ave and S Galena Ave (IL Route 26) meet, with the potential for commercial use. Discussions are underway regarding rezoning. This listing includes 2 houses on...
$214,000
$214,000
Available: Right Now
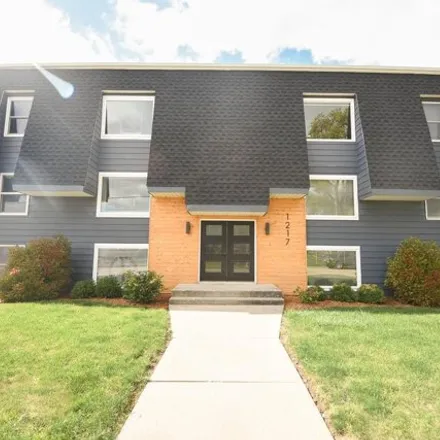
Your forever home awaits. Come check out this beautiful move in ready house on Dixon's North East Side. The main floor was remodeled in 2020. It features an eat in kitchen with stainless steel appliances, and hardwood laminate flooring throughout. A ...
$155,000
$155,000
Available: Right Now
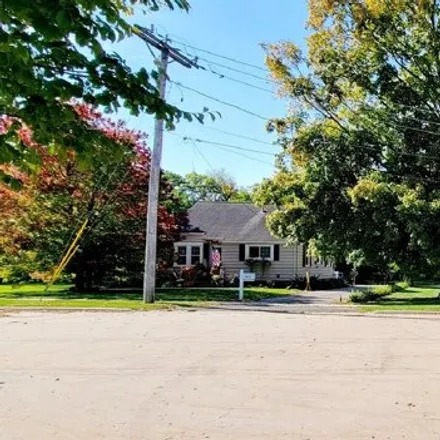
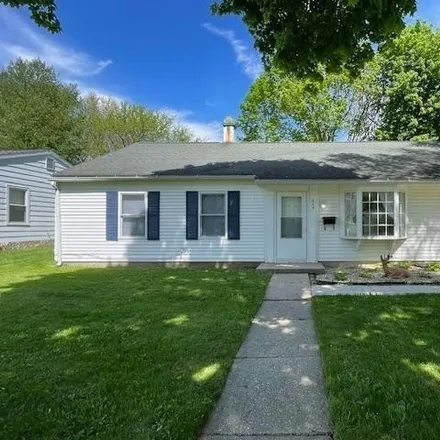
This house is a must see ! This Ranch home has an open floor plan with 4 bedrooms, 1 bath and 1 car garage. Entering the front door into the living room you will find brand new vinyl plank flooring flows throughout the home. The Kitchen has ni...
$85,900
$85,900
Available: Right Now
$212,000
$212,000
Available: Right Now
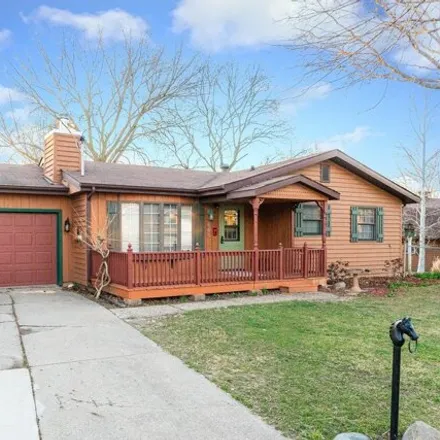
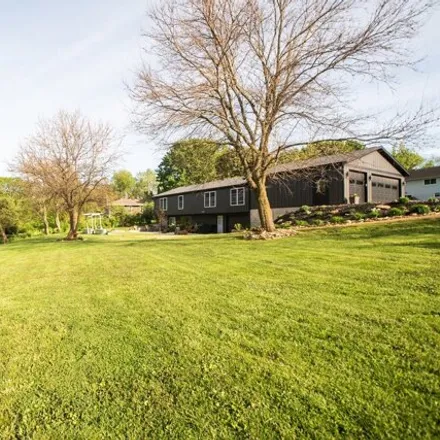
Ranch home with two lots, attached garage, plus large barn styled/garage/outbuilding with loft on 2nd lot. This home features main floor living room, kitchen, dining room, 2 bedrooms, plus family room (addition) and small den/office with wood burner ...
$129,000
$129,000
Available: Right Now
Vinyl Siding, Updated Roof (2019), Water Heater (2020), Furnace and Central Air (2008). Enclosed front porch, fenced backyard, 2 car garage, foyer with open staircase, kitchen updated in 2019, fireplace in the living room, 3 bedrooms, 1 and 1/2 bathr...
$159,900
$159,900
Available: Right Now
Do not miss out on this beautiful done 2 bedroom condo! Top notch interior with custom touches. The condo was redone in 2018. Updates include all new insulation, wiring, flooring, and tankless water heater. All new doors and trim as well as new windo...
$145,900
$145,900
Available: Right Now
Versatile means many possibilities, and this property definitely has that!! This3BR, 2BAhome was previously used as a duplex, but could be easily converted to a 4BR single family home. Plus, it's zoned B-1, so the possibilities for investment are end...
$159,900
$159,900
Available: Right Now
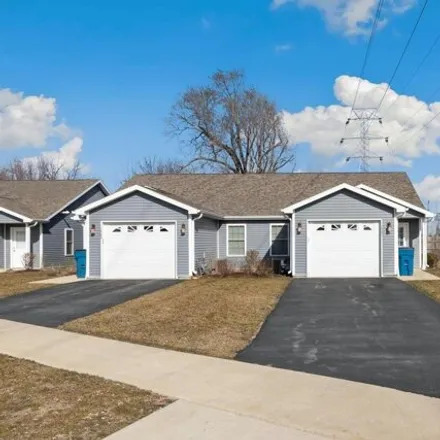
Conveniently located near the new Park District venue and sports fields - Living room , kitchen/dining combo and enclosed back porch on the main floor, 3 bedrooms and full bath on 2nd level, basement has a recreation room, laundry and full bath , 2 c...
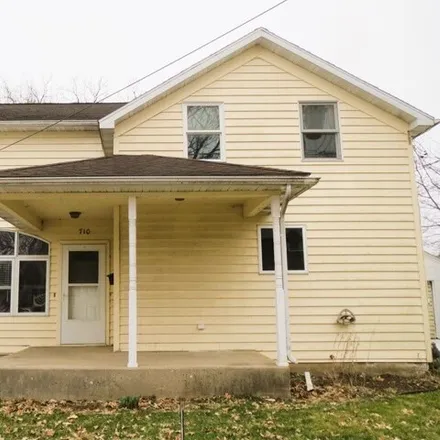
$90,000
$90,000
Available: Right Now
$169,500
$169,500
Available: Right Now
Cheery home in NE Dixon. This home features 3 bedrooms, 2.5 baths, and is in very good condition. The main floor has an open living/family room area, and a cute kitchen with a small breakfast bar. There is also a separate main floor laundry room with...
$119,999
$119,999
Available: Right Now
Current lease is $1050 per month and lease is till12/31/2024Welcome to this 3 bedroom 2 full bath. Low taxes, don't wait to see this one! New from top to bottom! around 1400+ total finished sq ft area. Nice exterior. Large bedrooms, master bedroom ha...
$99,900
$99,900
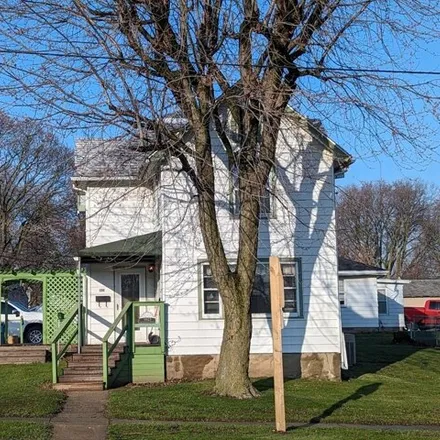
Available: Right Now
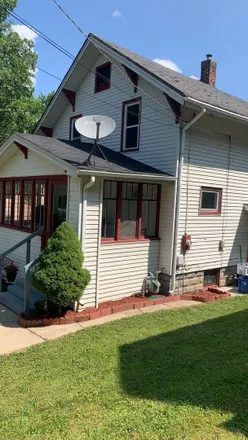
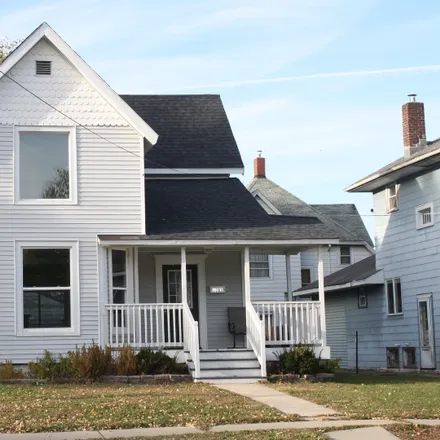
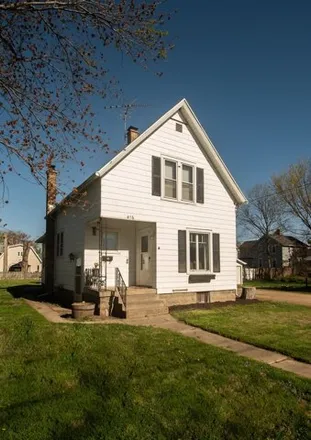
Come check out this 2 story house on Dixon's South side. The house features first floor laundry, full bathroom upstairs, half bath on main floor, and a shower in the basement. There are 2 bedrooms on the 2nd floor and a bonus room that could be a 3rd...
$189,000
$189,000
Available: Right Now
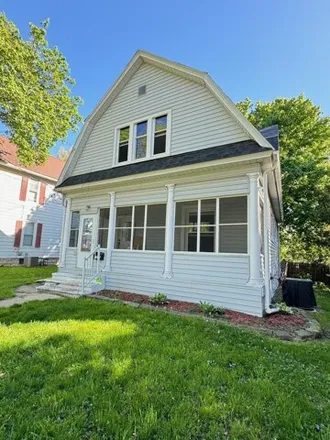
Welcome to the heart of Dixon, where this property offers an exceptional blend of location and charm. Situated just blocks from downtown restaurants, shops, and the new bike path, this beautiful 2-story home is a true gem. As you approach, an oversiz...
$169,900
$169,900
Available: Right Now
Recently built townhome with quick river access! Move right in and make it your own. This home offers a mix of practicality, functionality, and convenience of letting association dues cover exterior maintenance associated to snow removal and lawn car...
$359,900
$359,900
Available: Right Now
Gorgeous lakefront property. This unique home has approximately 250ft of water frontage. Fish from shore or take out the paddle boat that comes with the property. The sellers have done so much to this home and property for you to enjoy. The home has ...
$119,000
$119,000
Available: Right Now
Don't miss out on this adorable home! This place has a lot of farmhouse charm with some nice updates that include fresh paint throughout and all new flooring. Main floor has a nice sized living room, kitchen and dining room plus main floor bedroom. 2...
$164,900
$164,900
Available: Right Now
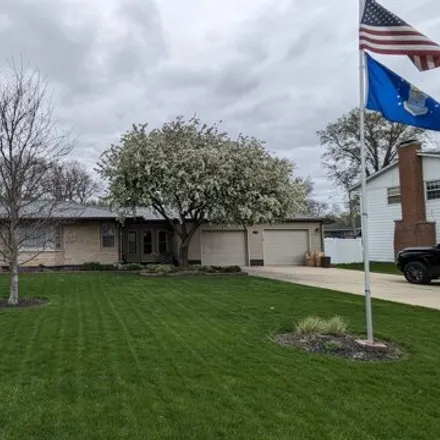
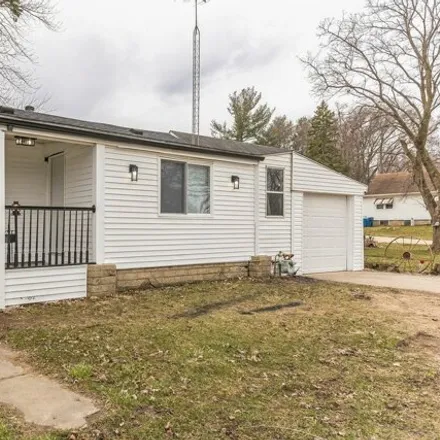
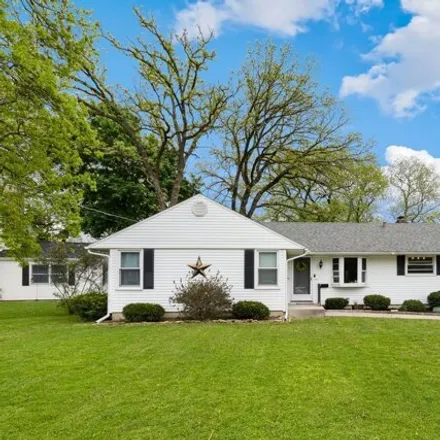
Welcome to this charming ranch home nestled in the desirable northeast of Dixon, with close proximity to parks and schools. Boasting 3 bedrooms and 1 bathroom, this residence offers charm and functionality. Step inside to discover a modern kitchen an...
$74,900
$74,900
Available: Right Now
Neat and tidy and well maintained, this one story home is move in ready. Nice front entry with enclosed porch, charming built-ins, full useable basement. Basement could be good for workout room, storage, or other creative uses. Shower, sink, and stoo...
$399,000
$399,000
Available: Right Now
One of a Kind! This ageless beauty is one of Dixon's most beautiful homes. You will be awed by the quality workmanship throughout- from the original oak woodwork (in excellent condition!) to the amazing doors, built-ins, and a 1990 addition with a la...
Dixon
According to statistics, the population in Dixon, IL amounts to 15,257, which shows growth 3% compared to the previous year. The median age of the city’s residents is 40. The average household income is $54,353, shifting growth 7% from the past year, and the average property value in Dixon, IL decline 0% to $92,300 throughout the year.
What is the Average Price of Apartments for Sale in Dixon, IL, 61021?
| Month | Median Price |
|---|---|
| Apr 2024 |
$370,482
|
| Mar 2024 |
$370,482
|
| Feb 2024 |
$370,482
|
| Jan 2024 |
$370,482
|
| Dec 2023 |
$255,545
|
| Nov 2023 |
$157,997
|
Household Income
The average household income in Dixon, IL grew from $51,000 to $54,353 in the past year. This data is an estimate based upon 5,331 households in Dixon, IL . The chart below presents how household income is distributed in Dixon, IL in comparison to the revenue allocation amid households nationally.
Property Value
According to data from last year, the average property value in Dixon, IL shifted from $92,100 to $92,300 throughout the year. The subsequent graph indicates the share of properties in the given price range in Dixon, IL in comparison to the median property value in the same price segment across the country. According to the data, the greatest share of Dixon, IL properties falls in the '$80,000 to $89,999' range, which is lower than the most significant median property across the country.
Property Taxes
One of the most important aspects for property owners is the amount of property taxes. This graph shows distribution of property taxes in Dixon, IL compared to median property taxes around the country. The prevalent amount of property taxes in Dixon, IL equals $2500, which is less than the national average.