Dyersburg, TN 38024, USA apartments for sale

$229,900
$229,900
Available: Right Now
Fresh and move in ready! 3 bed 2 bath home in the heart of Dyersburg. Freshly painted interior, refinished hardwoods, updated bathrooms, new kitchen countertops, and stainless appliances. This spacious home has so much natural light with large rooms ...
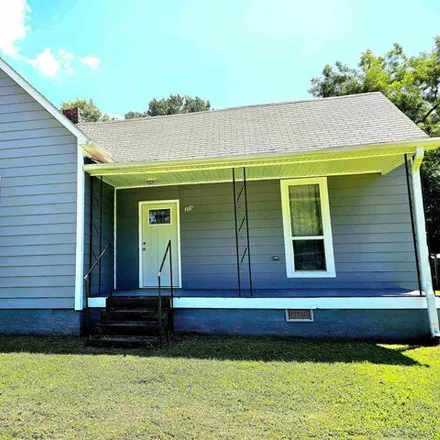
$149,000
$149,000
Available: Right Now
Welcome to this beautifully remodeled home nestled in the heart of Dyersburg, TN. With a total of1, 443square feet, this residence offers a perfect blend of modern upgrades and cozy charm. The property features 3 bedrooms, 2 bathrooms, and a detached...
$419,900
$419,900
Available: Right Now
You don't want to miss this gorgeous home located on the 17th Fairway of the Farms Golf Course. Great for indoor and outdoor entertaining with a new covered back porch. In close proximity to schools, shopping and dining make it a great choice. 3 bedr...

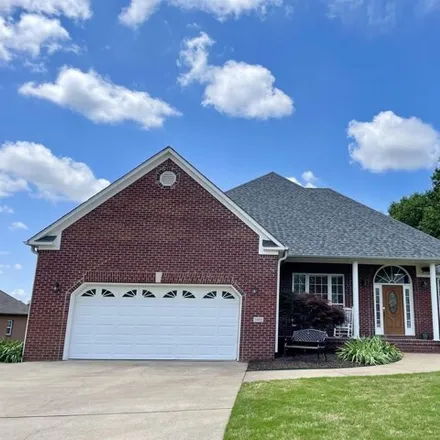
$389,900
$389,900
Available: Right Now
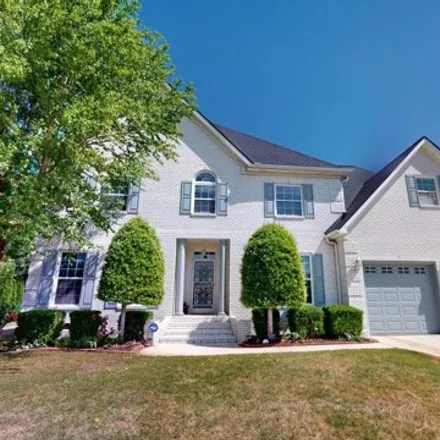
Lovely4BR, 2BAbrick home, 2 car garage, fenced yard in a fabulous neighborhood! Open floor-plan, vaulted family room, built-in octagon ceiling medallion in the dining room, large kitchen with crisp white cabinets, granite counter-tops, and stainless ...
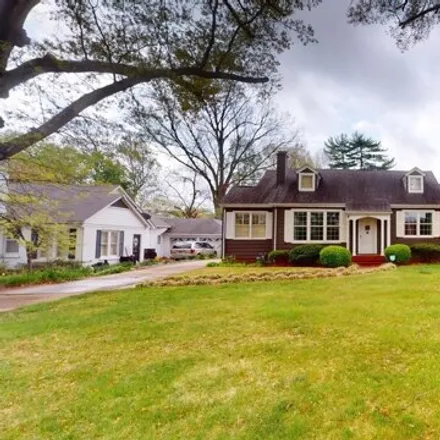
$365,000
$365,000
Available: Right Now
This beautiful southern living home is right in the heart of town. All three bedrooms have a bathroom and theres a study thats accessible from the primary bedroom or main living area. The kitchen is large and boasts a versatile island and so many cab...
$639,950
$639,950
Available: Right Now
Your dreams will come true with this beautiful home. The home has 4 bedrooms (2 down and 2 up), 4.5 baths, a formal dining room, an open floor concept with a breakfast room. The primary bath is what your dreams are made of. It features a wet room wit...
$539,900
$539,900
Available: Right Now
All brick home with5 BR, 3.5 BA,tile and hardwood throughout lower level containing the dinning room, open living room, kitchen with large pantry, and separate laundry room. All bedrooms upstairs with two bedrooms w/en suites, 2 bedrooms separated by...

$200,000
$200,000
Available: Right Now
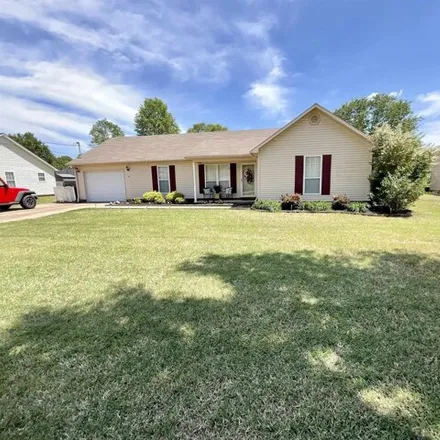
This 4BR/3bathroom house is move-in ready. It has been recently refurbished with new paint, flooring, kitchen appliances, fans and lighting. It is close to all city amenities. New HVAC's will keep you cool in summer and warm in winter. Outback is a f...

$279,900
$279,900
Available: Right Now
Discover this charming, well-maintained two-story home in Dyersburg! With four spacious bedrooms, including a master suite on the main level, and two baths, this home offers plenty of space. The updated kitchen boasts stainless steel appliances and a...

$179,900
$179,900
Available: Right Now
Dont miss your opportunity to call 911 Wren home! Right inside the front door is the spacious, but cozy living room featuring large windows on the front of the house for lots of natural light! The compact yet efficient kitchen retains its original ch...

$170,000
$170,000
Available: Right Now
Welcome to this charming triplex located in Dyersburg, TN! This property offers the perfect combination of comfort and convenience, making it the ideal choice for investors or owner-occupants. All units feature 2 bedrooms, 1 bathroom and a spacious l...

$189,900
$189,900
Available: Right Now
Charming country home with3BR, 1BA.This home has an open and flowing floor plan with spacious living and dining areas. The open front porch is new, perfect for entertaining. A covered rear porch affords additional space for enjoying the outdoors. Roo...

$254,900
$254,900
Available: Right Now
Immaculate !! 3 BR, 2Bath home w/2 car garage on a cove lot. Nicely landscaped with a privacy fenced in backyard and covered patio for entertaining. Great location! Move in ready. All appliances stay as well as washer and dryer. Newer roof and...

$289,900
$289,900
Available: Right Now
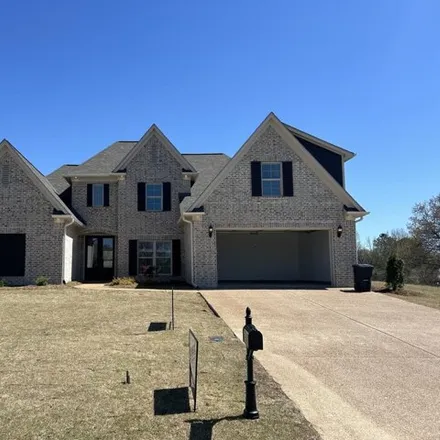
Don't miss out on this beautiful 5 bedroom 3 bath home in a great location! Lot's of extra room for a office/study, exercise room, or an entertainment room! Less than a mile from Three Oaks Middle School, and minutes from Dyersburg. This is a lovely ...

$225,000
$225,000
Available: Right Now
Large4BR 3BAbrick home in the county, large yard, mother in law suite with it's own living room, kitchen, bedroom and bath. The large laundry room joins the suite to the main home with an eat in kitchen, living room, dining, den, 3 bedrooms and 2 ful...
$279,900
$279,900
Available: Right Now
This well-maintained 4 bedroom, 2 bath house is the epitome of comfort and convenience with a welcoming atmosphere. A great split floor plan, with a spacious living room leads into the eat in kitchen. All kitchen appliances and washer and dryer are i...
$549,950
$549,950
Available: Right Now
This stunning five (5) bedroom and 3 bath home is a dream. The primary suite includes a master bath with double sinks, separate water closet, large wet room with a deep soaker tub and 2 shower heads, and a large walk-in closet. There are too many ame...
$149,900
$149,900
Available: Right Now
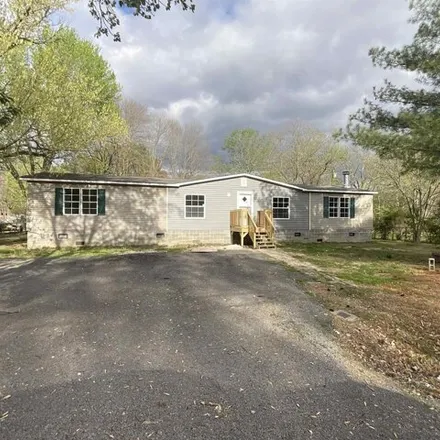
Spacious, updated and Move-In READY!! This 3 Bedroom, 2 Bath manufactured home sits on a Brand NEW block foundation along with new HVAC and a completely NEW interior! New laminate wood flooring and NEW carpet. All new paint. This home includes a form...

$164,500
$164,500
Available: Right Now
Wow!! 2BR 1BAlovely craftsman style front porch, 1 car carport. extra parking space, fenced yard with a storage building. NEW... HVAC,roof, gutters, painted brick, sidewalk, windows, doors and shutters. Inside new lighting, LVP flooring, kitchen cabi...
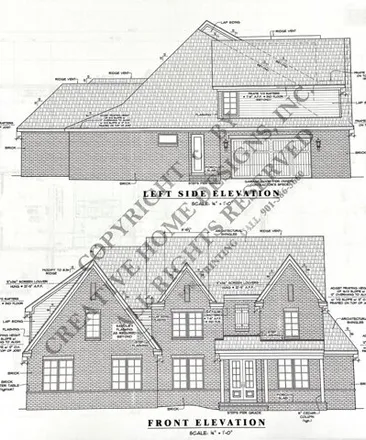
$639,950
$639,950
Available: Right Now
New construction (estimated completion date9/1/2024) Discover your dream home when you walk into this beautiful home with 4 bedrooms (3 down and 1 up), 3.5 baths with an open floor plan. It is approximately3, 950heated square feet. This home h...

$279,000
$279,000
Available: Right Now
Very attractive 4 bedroom 2 bath home with double garage. This very spacious home features a large living room, recessed lighting, hardwood, sun room, good size bedrooms, large heated and cooled storage area off garage, nice kitchen, dining, pantry a...
$199,900
$199,900
Available: Right Now
Wonderful 3 br, 2 ba, brick home in a great neighborhood! Home features an attached carport w/ storage closet, fenced yard, covered front porch, open patio, and storage building all on a corner lot. Inside features: kitchen open to large dining area,...
Dyersburg
According to statistics, the population in Dyersburg, TN amounts to 16,666, which shows decline -1% compared to the previous year. The median age of the city’s residents is 41. The average household income is $36,820, shifting growth 3% from the past year, and the average property value in Dyersburg, TN decline -4% to $99,900 throughout the year.
Household Income
The average household income in Dyersburg, TN grew from $35,699 to $36,820 in the past year. This data is an estimate based upon 7,035 households in Dyersburg, TN . The chart below presents how household income is distributed in Dyersburg, TN in comparison to the revenue allocation amid households nationally.
Property Value
According to data from last year, the average property value in Dyersburg, TN shifted from $103,900 to $99,900 throughout the year. The subsequent graph indicates the share of properties in the given price range in Dyersburg, TN in comparison to the median property value in the same price segment across the country. According to the data, the greatest share of Dyersburg, TN properties falls in the '$125,000 to $149,999' range, which is lower than the most significant median property across the country.
Property Taxes
One of the most important aspects for property owners is the amount of property taxes. This graph shows distribution of property taxes in Dyersburg, TN compared to median property taxes around the country. The prevalent amount of property taxes in Dyersburg, TN equals $800, which is less than the national average.