Elizabeth City, NC 27909, USA apartments for sale
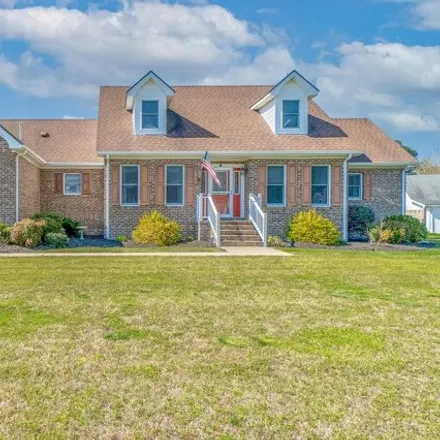
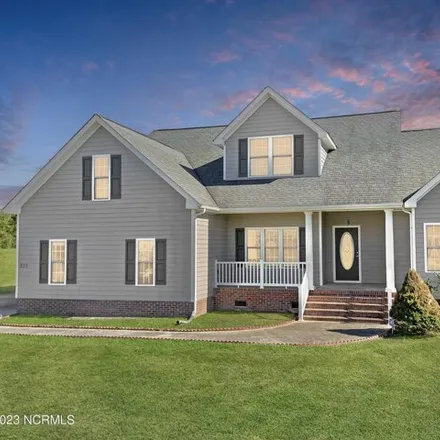
$450,000
$450,000
Available: Right Now
Welcome to your exquisite retreat in the heart of Northeastern Terrace, where this captivating Cape Cod awaits your arrival. This meticulously maintained residence invites you with its charming curb appeal, boasting beautiful landscaping and mature t...
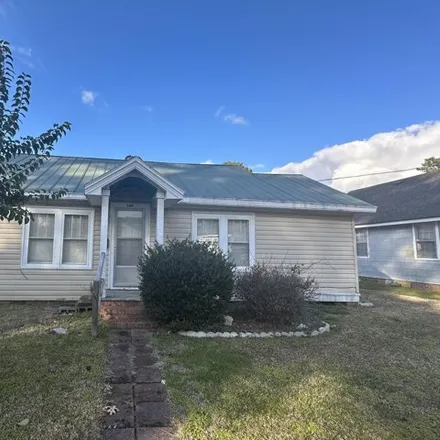
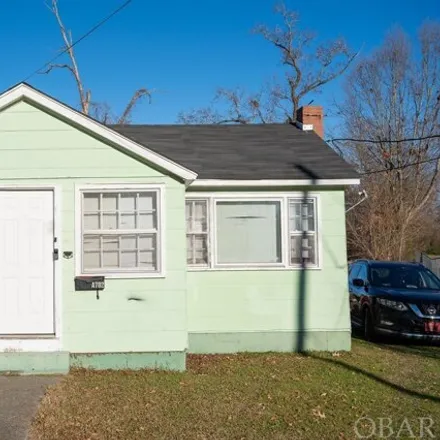
$164,900
$164,900
Available: Right Now
Welcome to this charming 2-bed, 1-bath bungalow, a cozy haven that effortlessly combines character and practicality. As you step inside, you'll be greeted by a warm and inviting atmosphere, perfect for those seeking comfort and simplicity. A unique f...
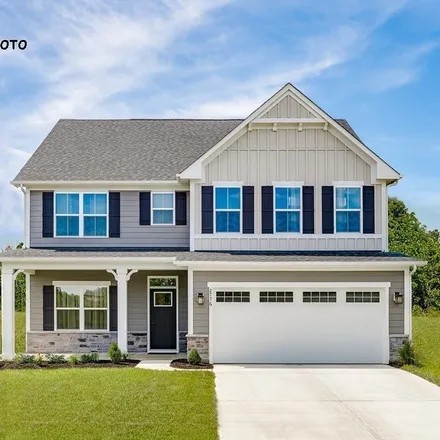
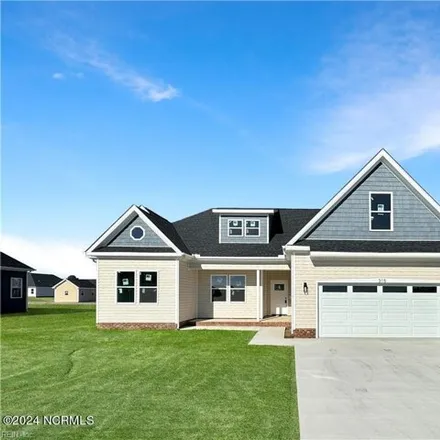
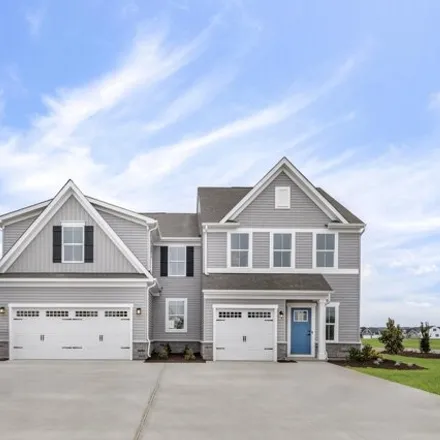
$474,990
$474,990
Available: Right Now
$400,000
$400,000
Available: Right Now
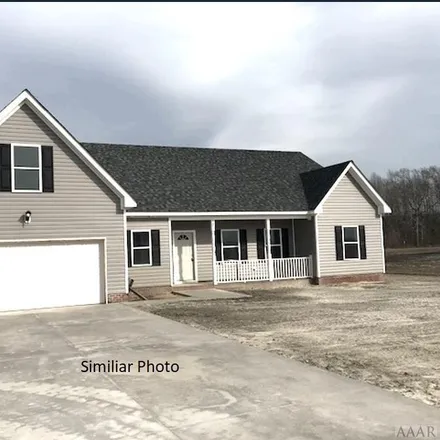
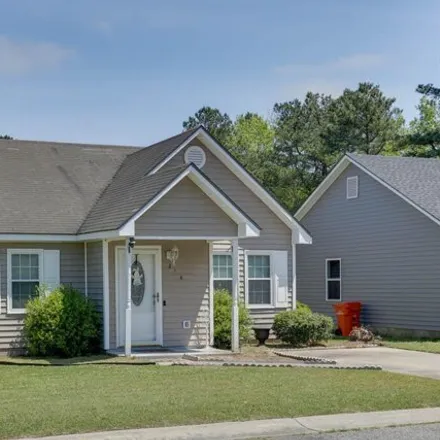
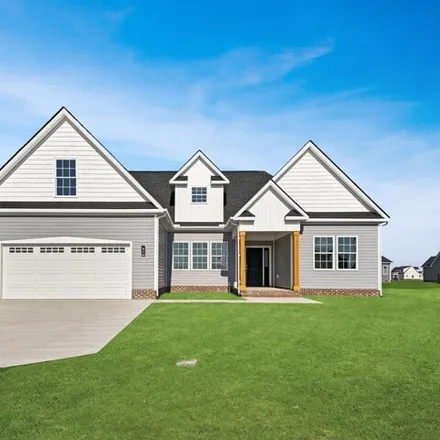
$409,900
$409,900
Available: Right Now
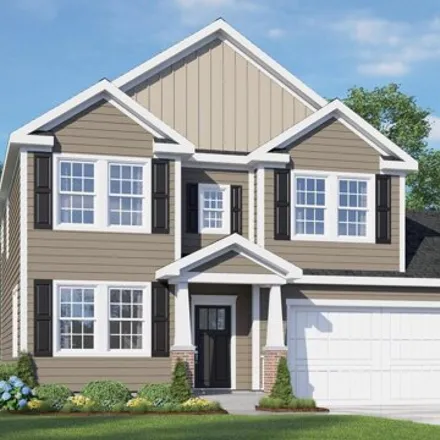
Check out our newer model in our Benchmark Series, The Georgetown! This stunning home boasts an open floorplan that creates an amazing living space. Upon entry, you'll be greeted with a charming foyer that leads to an open and flexible Living Room/Di...
$312,600
$312,600
Available: Right Now
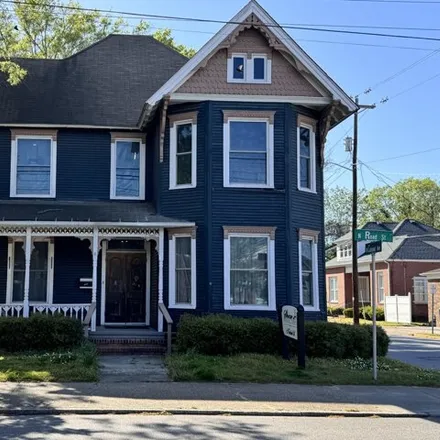
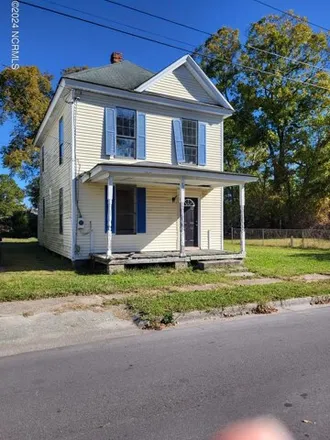
Located in beautiful downtown Elizabeth City. This home offers a ton of character. Discover the perfect blend of residential comfort with commercial opportunity. With mixed-use zoning, this property offers large rooms and the space for residential li...
$399,000
$399,000
Available: Right Now
$250,000
$250,000
Available: Right Now
$89,000
$89,000
Available: Right Now
Looking for your next investment property? Look no further. The work has already been started and just needs you to finish it. Updates already completed include the following electrical work, plumbing, sheetrock to the rooms, new half bath to downsta...
$521,900
$521,900
Available: Right Now
At the heart of the Ambler, you'll find the kitchen, which curates a culinary haven where creativity knows no bounds. Picture this: on a lazy Sunday morning, sunlight streams through the windows, turning the kitchen into a warm oasis. As you sip on y...
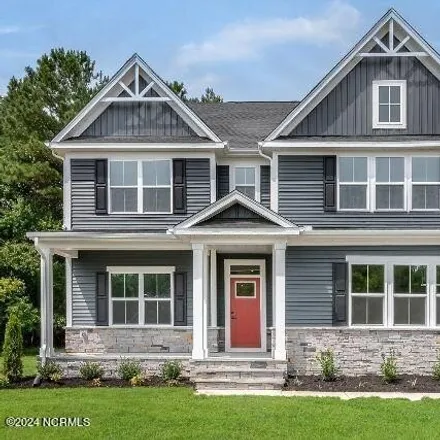
$364,900
$364,900
Available: Right Now
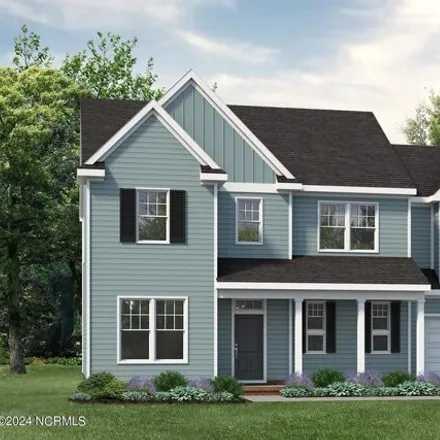
This stunning new construction residence offers the perfect blend of modern elegance and functionality, providing an unparalleled living experience for you. Step inside to discover a spacious and inviting layout, featuring four bedrooms and two and a...
$210,000
$210,000
Available: Right Now
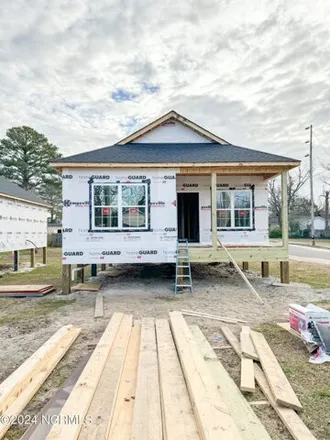
Beautiful, new construction located within walking distance of downtown Elizabeth City and the waterfront. This 3-bedroom, 2-bathroom house features granite countertops, LVP flooring in the living area, and cozy carpeted bedrooms. It even includes an...
$195,000
$195,000
Available: Right Now
Tanquil Old Oak Homeowners Association, offering a seamless blend of spacious indoor living and inviting outdoor spaces. The heart of the home features a large great room and dining area, leading into a practical galley-style kitchen equipped with an...
$399,990
$399,990
Available: Right Now
Tooley Harbor Single-Family is Coming soon ! Get to know more about The Greenwood. This 2- to 3-car garage single-family home spotlights style and convenience. Gather friends and family in the great room before enjoying a delicious meal cooked...
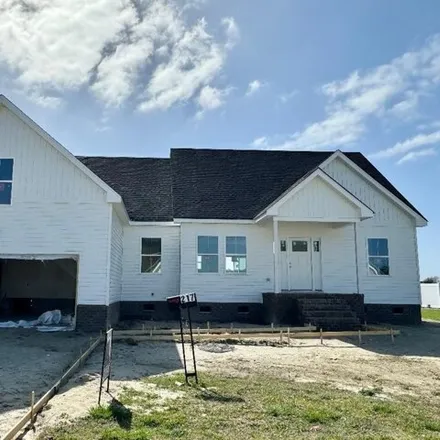
$395,000
$395,000
Available: Right Now
New construction home being built and located in Tooley Harbor. This home boasts 4 bedrooms and 2 full and 1 1/2 bathrooms. The kitchen features beautiful granite tops, spacious island and soft close cabinets. Additionally, the home features a...

$425,000
$425,000
Available: Right Now
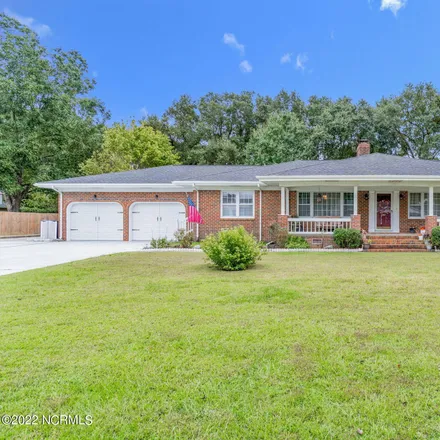
Welcome to 1009 Riverside Ave, This delightful 1945-built home offers a serene retreat with its classic features and convenient amenities. As you step inside, you're greeted by the warmth of hardwood floors that flow throughout the home. As you enter...
$224,990
$224,990
Available: Right Now
Welcome to Adam's Landing! This home is complete - move in this April! Homeownership is calling, do not miss the opportunity to be apart of our brand new townhomes from the low $200s. Fall in love with this new community of affordable 2-story townhom...
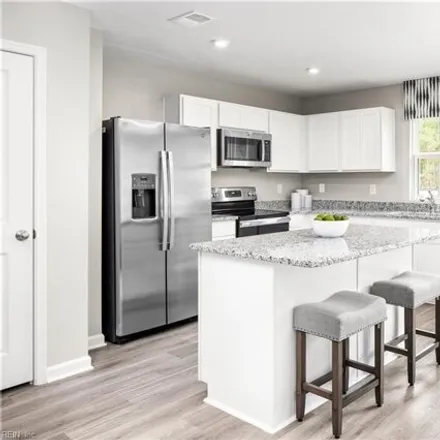
$274,990
$274,990
Available: Right Now
Welcome to Tooley Harbor Villas!!! This sale only - all appliances included ! The Roxbury is designed for modern living offering a robust floorplan with attached 1-car garage. From the welcoming foyer, past a conveniently located powder room, ...
$455,000
$455,000
Available: Right Now
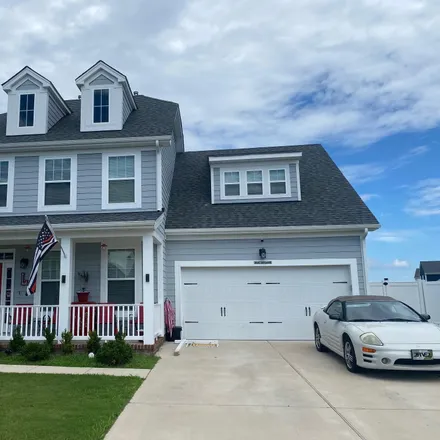
Check out this beautifully maintained home in the sought after neighborhood of Pelican Pointe. It has cathedral ceilings, fireplace, solid surface counters, a large primary suite, with double vanities, make-up vanity, soaking tub, glass enclosed show...
$124,900
$124,900
Available: Right Now
Discover the charm of this hidden gem a small bungalow set back off the street, offering a perfect blend of privacy and coziness. This delightful home presents an excellent opportunity for those seeking a great starter home or a savvy investment prop...
$479,900
$479,900
Available: Right Now
Contemporary home offers the upgrades you'll love without trading the quality or craftsmanship you deserve. Granite countertops throughout, stainless appliances, slow-close cabinetry, 9 ft. ceilings, fully-finished garage with smart garage door opene...
$415,481
$415,481
Available: Right Now
Elizabeth City
According to statistics, the population in Elizabeth City, NC amounts to 17,732, which shows decline -2% compared to the previous year. The median age of the city’s residents is 33. The average household income is $34,424, shifting growth 3% from the past year, and the average property value in Elizabeth City, NC growth 6% to $137,200 throughout the year.
What is the Average Price of Apartments for Sale in Elizabeth City, NC, 27909?
| Month | Median Price |
|---|---|
| Apr 2024 |
$269,085
|
| Mar 2024 |
$269,085
|
| Feb 2024 |
$269,085
|
| Jan 2024 |
$269,085
|
| Dec 2023 |
$316,049
|
| Nov 2023 |
$276,144
|
Household Income
The average household income in Elizabeth City, NC grew from $33,398 to $34,424 in the past year. This data is an estimate based upon 6,579 households in Elizabeth City, NC . The chart below presents how household income is distributed in Elizabeth City, NC in comparison to the revenue allocation amid households nationally.
Property Value
According to data from last year, the average property value in Elizabeth City, NC shifted from $129,000 to $137,200 throughout the year. The subsequent graph indicates the share of properties in the given price range in Elizabeth City, NC in comparison to the median property value in the same price segment across the country. According to the data, the greatest share of Elizabeth City, NC properties falls in the '$150,000 to $174,999' range, which is lower than the most significant median property across the country.
Property Taxes
One of the most important aspects for property owners is the amount of property taxes. This graph shows distribution of property taxes in Elizabeth City, NC compared to median property taxes around the country. The prevalent amount of property taxes in Elizabeth City, NC equals $1150, which is less than the national average.