Geneva, OH 44041, USA apartments for sale
$129,900
$129,900
Available: Right Now
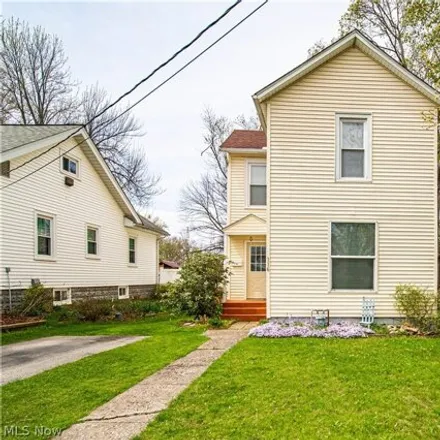
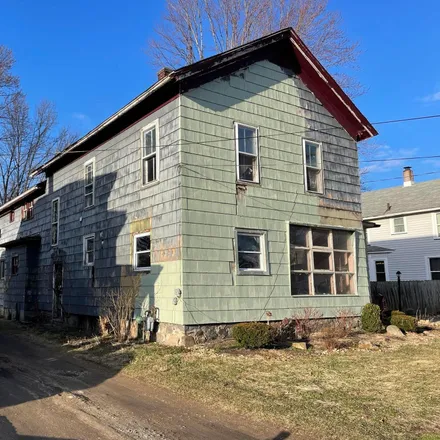
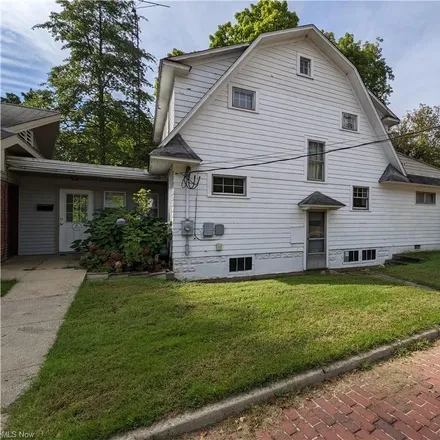
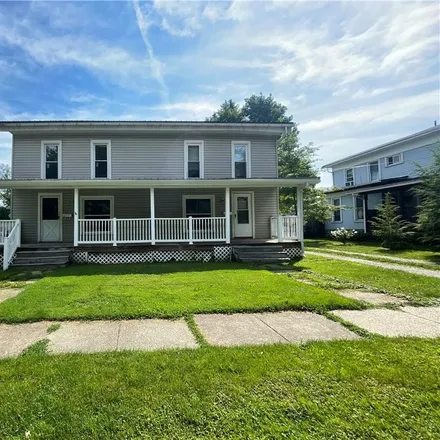
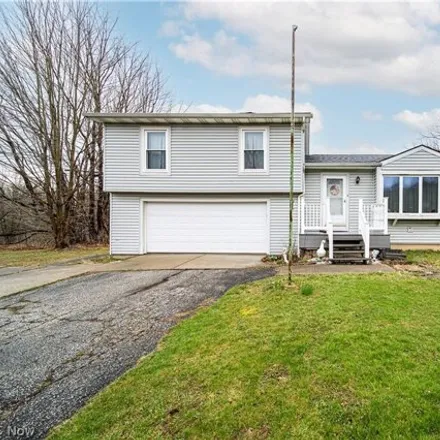
Welcome to your charming two-story abode, nestled in a serene neighborhood where comfort meets convenience. This delightful home offers ample space for relaxation and rejuvenation as well as established options for customizing to your needs. Step ins...
$309,900
$309,900
Available: Right Now
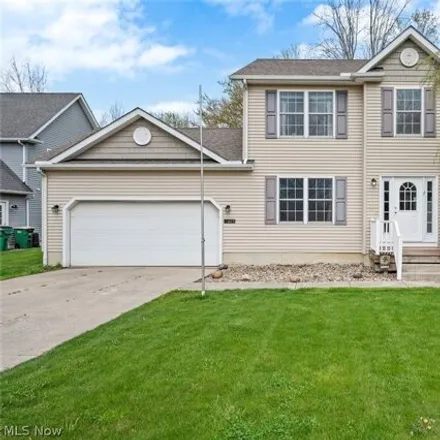
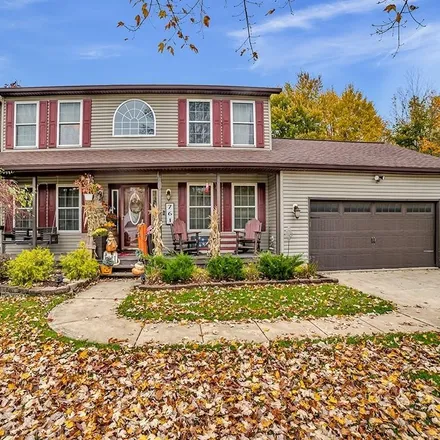
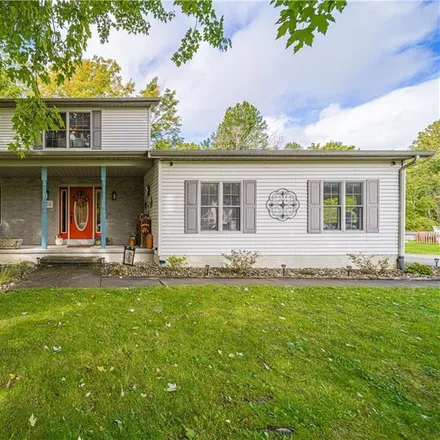
Welcome to this well-maintained and move in ready Center Hall Colonial home that features 4 bedrooms, 2 full and 1 half bath, sits onOVER.50acres, attached 2 car garage, and located in the highly desirable and family friendly Westwood Estates Develop...
$100,000
$100,000
Available: Right Now
$425,000
$425,000
Available: Right Now
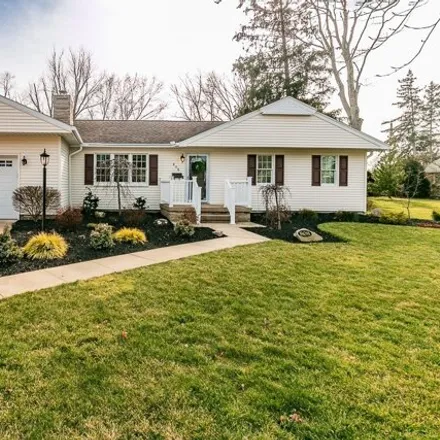
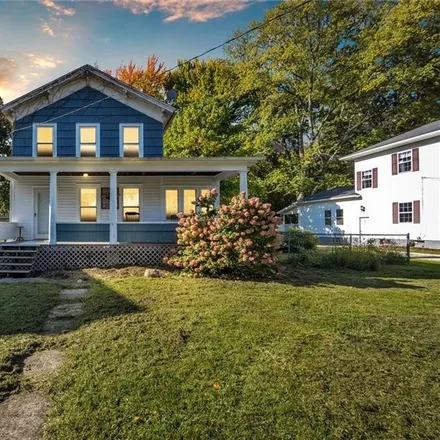
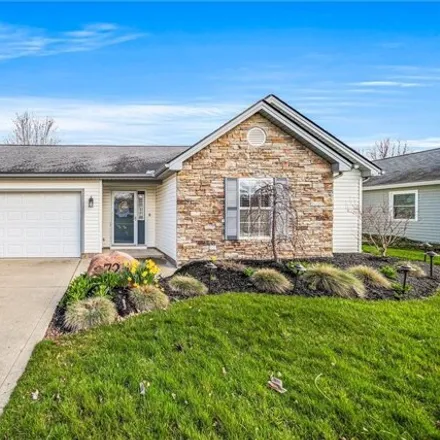
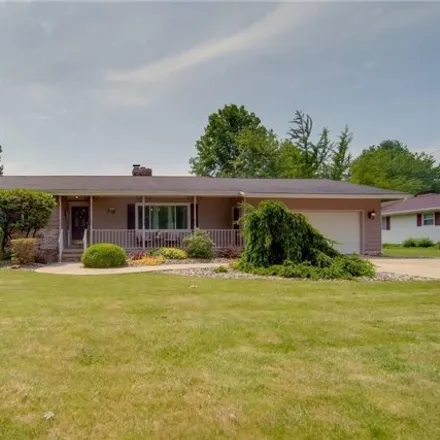
Welcome to this absolutely stunning home in Geneva. A completely updated ranch with so many outstanding amenities you may never want to leave. The main level of the home features gorgeous maple hardwood flooring, a kitchen complete with stainless ste...
$149,900
$149,900
Available: Right Now
$124,900
$124,900
Available: Right Now
$55,000
$55,000
Available: Right Now
$119,977
$119,977
Available: Right Now
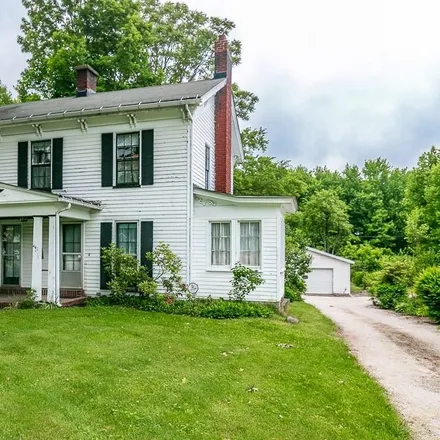
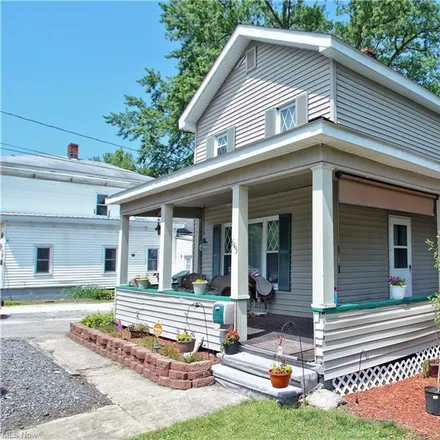
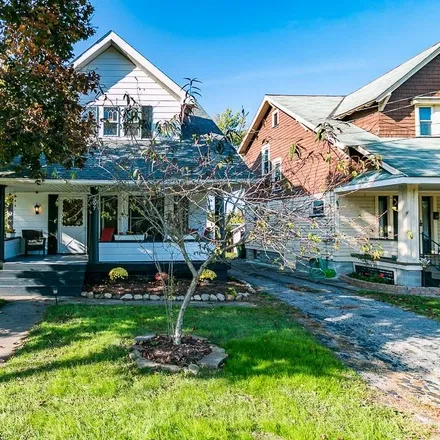
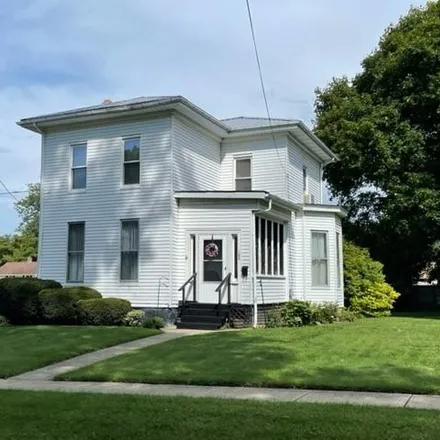
First time on the market as this home has been in the family since it was built. You will love the beautiful original hardwood floors in some of the rooms and trim with built-ins throughout. A formal dining room that opens to a large living room is g...
$298,500
$298,500
Available: Right Now
$134,900
$134,900
Available: Right Now
$299,900
$299,900
Available: Right Now
$169,900
$169,900
Available: Right Now
$159,000
$159,000
Available: Right Now
$69,900
$69,900
Available: Right Now
$305,000
$305,000
Available: Right Now
$250,000
$250,000
Available: Right Now
Super Sharp Ranch in much sought after Geneva Subdivision!! Just 6 minutes from RT 90 and Spire Institute and lovely Lake Erie, Close to schools and shopping. This home has an Open Floor Plan, High Ceilings and an Impeccable Neutral Dcor!!! Well Main...
$235,000
$235,000
Available: Right Now
Welcome to 5301 Clay Street! This split level home is located in Harpersfield Township in close proximity to Geneva on the Lake and Easy access to I-90! This cared for home is situated on 1.48 acres of open land and peaceful scenic views! Entertain i...
$173,900
$173,900
Available: Right Now
Beautiful 2 Bedroom 2 Bath Condo in desirable Geneva! To be built starting this spring 2024 (last 2 condos left are lot 13 ~201 Nantucket and lot 14 ~200 Nantucket. Hurry in to get on the schedule before it's too late! Pick your style, textures and p...

$159,900
$159,900
Available: Right Now
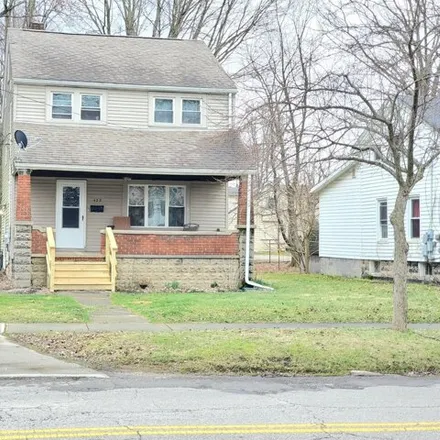
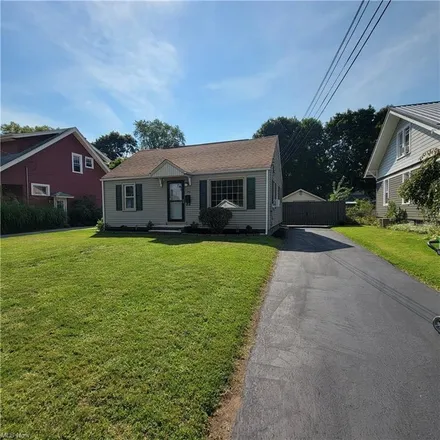
Check out this 3 bed 1 bath home in the heart of Geneva on a corner lot! Fresh paint and carpet. 1st floor bed, bath and laundry. Light and bright eat-in kitchen with natural wood cabinetry, Stove and fridge stay. Formal dining and eat-in kitchen are...

$159,900
$159,900
Available: Right Now
Check out this 3 bed 1 bath home in the heart of Geneva on a corner lot! Fresh paint and carpet. 1st floor bed, bath and laundry. Light and bright eat-in kitchen with natural wood cabinetry, Stove and fridge stay. Formal dining and eat-in kitchen are...
$319,000
$319,000
Available: Right Now
Don't let the exterior view fool you. This ranch style home offers 6 bedrooms, 3.5 baths 2 kitchens, family room living-room, and a rec room in the lower level. Could be used as an in-law suite. Finished basement. Kitchen on main floor stunning, cher...
Geneva
According to statistics, the population in Geneva, OH amounts to 6,030, which shows decline -1% compared to the previous year. The median age of the city’s residents is 44. The average household income is $38,043, shifting decline -9% from the past year, and the average property value in Geneva, OH decline 1% to $96,100 throughout the year.
What is the Average Price of Apartments for Sale in Geneva, OH, 44041?
| Month | Median Price |
|---|---|
| Apr 2024 |
$385,382
|
| Mar 2024 |
$385,382
|
| Feb 2024 |
$385,382
|
| Jan 2024 |
$385,382
|
| Dec 2023 |
$354,386
|
| Nov 2023 |
$399,403
|
Household Income
The average household income in Geneva, OH declined from $41,640 to $38,043 in the past year. This data is an estimate based upon 2,520 households in Geneva, OH . The chart below presents how household income is distributed in Geneva, OH in comparison to the revenue allocation amid households nationally.
Property Value
According to data from last year, the average property value in Geneva, OH shifted from $95,500 to $96,100 throughout the year. The subsequent graph indicates the share of properties in the given price range in Geneva, OH in comparison to the median property value in the same price segment across the country. According to the data, the greatest share of Geneva, OH properties falls in the '$100,000 to $124,999' range, which is lower than the most significant median property across the country.
Property Taxes
One of the most important aspects for property owners is the amount of property taxes. This graph shows distribution of property taxes in Geneva, OH compared to median property taxes around the country. The prevalent amount of property taxes in Geneva, OH equals $1150, which is less than the national average.