Kelseyville, CA 95451, USA apartments for sale
$445,000
$445,000
Available: Right Now
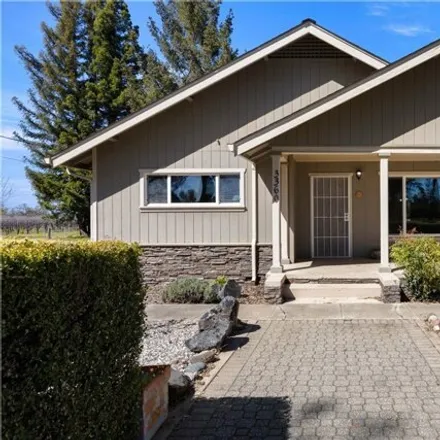
$589,000
$589,000
Available: Right Now
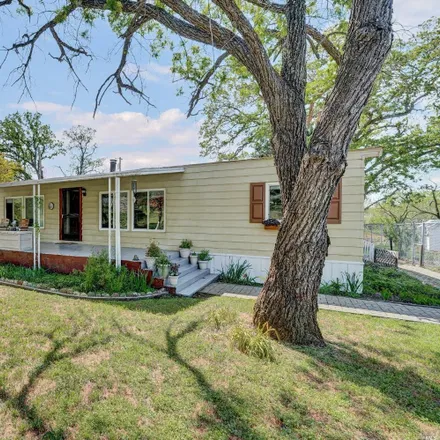
This one-of-a-kind property offers privacy, panoramic views, and endless possibilities on a sprawling 2.36-acre hilltop estate. Imagine waking up to breathtaking sunrise vistas over Big Valley, Mount Konocti, and the Mayacama Mountain range. Picture ...
$459,000
$459,000
Available: Right Now
Charming Multi-Level home with Creek Access! Located in charming, downtown Kelseyville, this multi-level home offers a blend of rustic charm and modern convenience. Boasting 3 bedrooms, 2.5 bathrooms, plus a versatile bonus room, this residence is a ...
$599,000
$599,000
Available: Right Now
Beautiful home with Kelsey Creek in your back yard! Main level features living room with cozy wood-burning fireplace, gourmet kitchen with mosaic tile backsplash, quartz countertops, spacious island, KitchenAid appliances, spacious cabinetry, recesse...
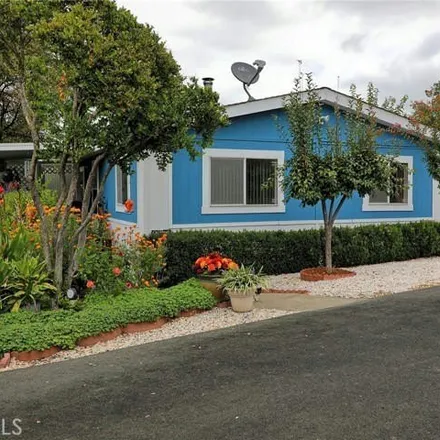
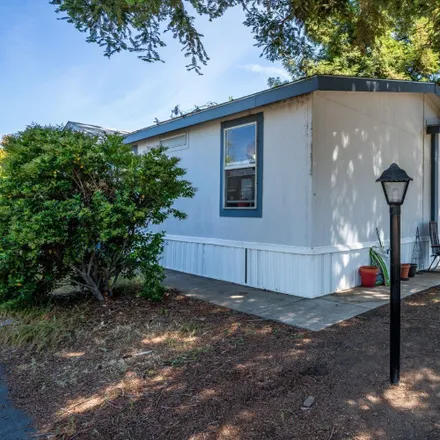
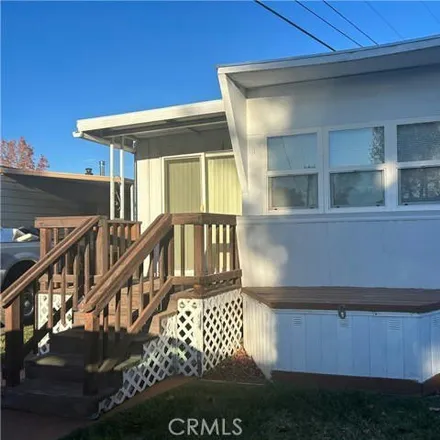
$139,000
$139,000
Available: Right Now
This three-bedroom two bath home is located in the Kelsey Creek family park right in the heart of Kelseyville. Home has been taken care of and is beautiful inside. Nice open living room has a wood burning stove. The large primary room has its own pri...
$965M
$965M
Available: Right Now
This special property consists of 2 separate contiguous parcels located on Hwy29/175,just a few minutes from Historic Downtown Kelseyville. The parcels are being sold together to capitalize on the overall development potential. Parcel 1: (5860 Live O...
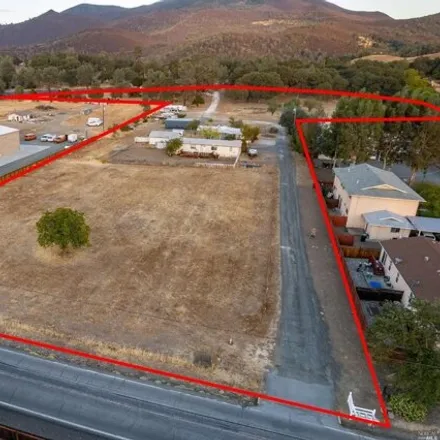
$965,000
$965,000
Available: Right Now
This special property consists of 2 separate contiguous parcels located on Hwy 29, just a few minutes from Historic Downtown Kelseyville. The parcels are being sold together to capitalize on the overall development potential. Parcel (1) 5880 Live Oak...
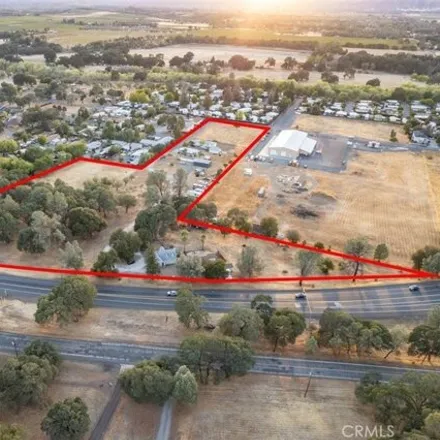
$1,8M
$1,8M
Available: Right Now
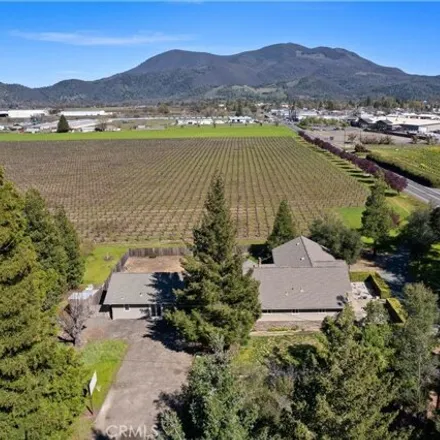
Incredible ranch right in Kelseyville town with a commanding view of Mount Konocti. Established vineyard consisting of 24 acres of Sauvignon Blanc and 4 acres of Merlot all under contract. Ranch consists of very diversified crops with Chandler walnut...
$139,900
$139,900
Available: Right Now
$139,500
$139,500
Available: Right Now
$70,000
$70,000
Available: Right Now
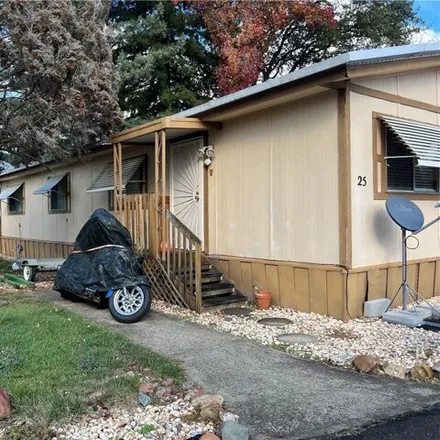
$85,000
$85,000
Available: Right Now
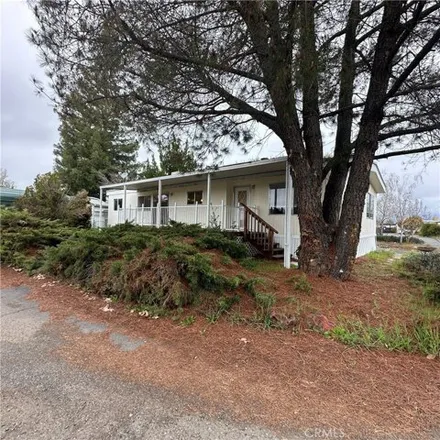
Kelseyville near town. FAMILYpark. Nice window blinds, 2 full bathrooms. Master bed has 2 full closets, vanity table, plus its own bathroom. This unit appears very clean, no stains or smells. Well kept. Nice grassy area and fenced back yard. Park has...
$34,000
$34,000
Available: Right Now
Apartment for sale in/on/near Rivers End, Lake County, CA 95451, USA. The price for this apartment is $34,000. Contact the agent to schedule an open house....
$189,000
$189,000
Available: Right Now
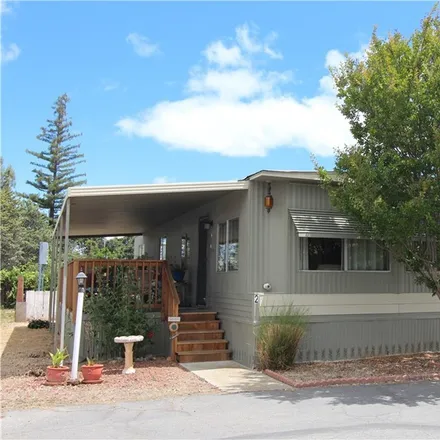
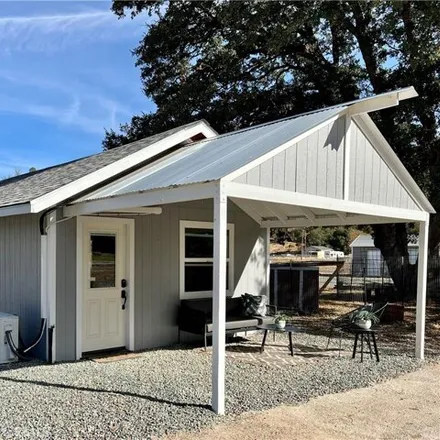
$69,000
$69,000
Available: Right Now
Must see manufactured home in this popular country all age family park with a swimming pool, outside showers and laundry room facilities. Just minutes from the lake. Home has vinyl windows, large corner lot, fenced yard. Perfect for a garden. Large d...
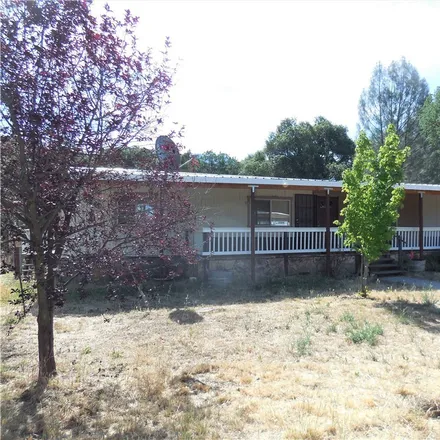
$524,500
$524,500
Available: Right Now
20 acres charming retreat cottage with workshop This charming retreat cottage is perfect for the long weekends or full-time living. This home was transformed in 2022 with comfort in mind! The cottage features a kitchen nook, laundry area, loft...
$1,8M
$1,8M
Available: Right Now
Incredible ranch right in Kelseyville town with a commanding view of Mount Konocti. Established vineyard consisting of 24 acres of Sauvignon Blanc and 4 acres of Merlot all under contract. Sits in the Ag is very diversified with Chandler walnuts Asia...
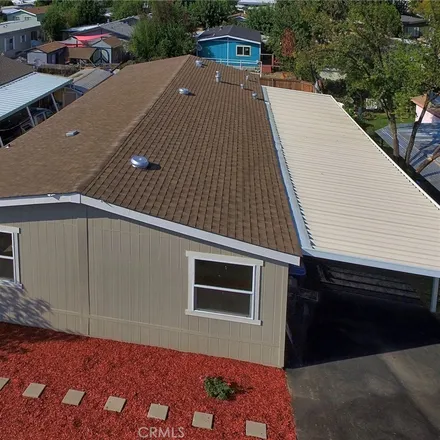
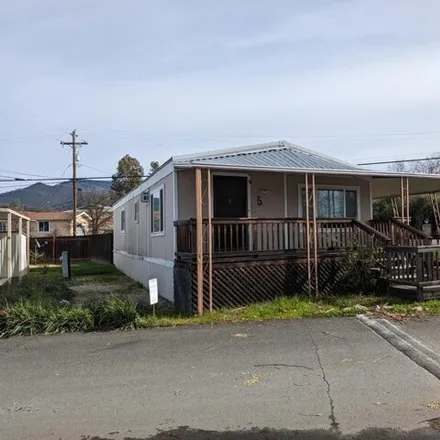
$72,500
$72,500
Available: Right Now
Nice and clean 2 bedroom 2 bath Manufactured home. New paint, new carpet. Turn key ready. This roomy home has a nice size living room and family room. Enjoy your morning coffee on the large deck. Master suite has separate bath and shower. You are rig...
Kelseyville
According to statistics, the population in Kelseyville, CA amounts to 3,647, which shows decline -5% compared to the previous year. The median age of the city’s residents is 41. The average household income is $32,463, shifting decline -3% from the past year, and the average property value in Kelseyville, CA decline -21% to $126,900 throughout the year.
Household Income
The average household income in Kelseyville, CA declined from $33,594 to $32,463 in the past year. This data is an estimate based upon 1,343 households in Kelseyville, CA . The chart below presents how household income is distributed in Kelseyville, CA in comparison to the revenue allocation amid households nationally.
Property Value
According to data from last year, the average property value in Kelseyville, CA shifted from $159,900 to $126,900 throughout the year. The subsequent graph indicates the share of properties in the given price range in Kelseyville, CA in comparison to the median property value in the same price segment across the country. According to the data, the greatest share of Kelseyville, CA properties falls in the '$150,000 to $174,999' range, which is higher than the most significant median property across the country.
Property Taxes
One of the most important aspects for property owners is the amount of property taxes. This graph shows distribution of property taxes in Kelseyville, CA compared to median property taxes around the country. The prevalent amount of property taxes in Kelseyville, CA equals $1150, which is less than the national average.