Kill Devil Hills, NC 27948, USA apartments for sale

$865,000
$865,000
Available: Right Now
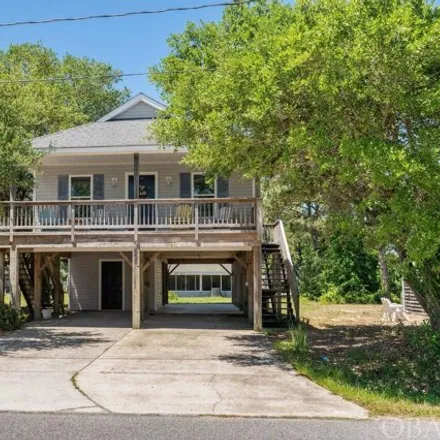
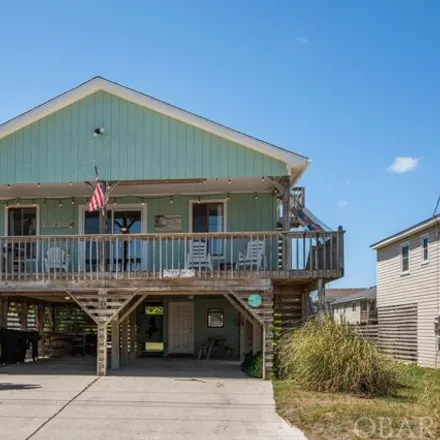
Welcome to Dune Our Thang, a charming semi-oceanfront property located in the heart of Kill Devil Hills, now available for sale. This 4-bedroom, 2-bathroom home offers the perfect blend of comfort and convenience, making it an ideal residence for any...

$599,990
$599,990
Available: Right Now
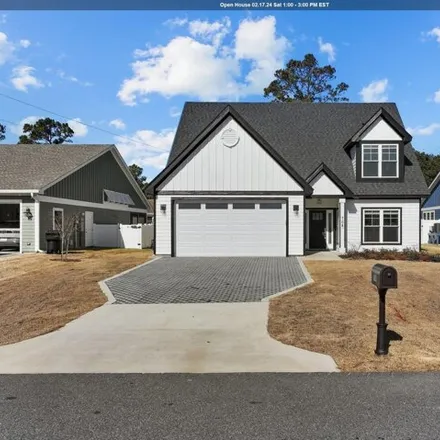
Welcome home to the Laurel II plan. This brand new 3-bedroom, 2-bathroom coastal cottage boasts the perfect blend of modern comfort and charm. Step inside and experience an efficient use of space, meticulously designed to maximize functionality witho...
$625,000
$625,000
Available: Right Now
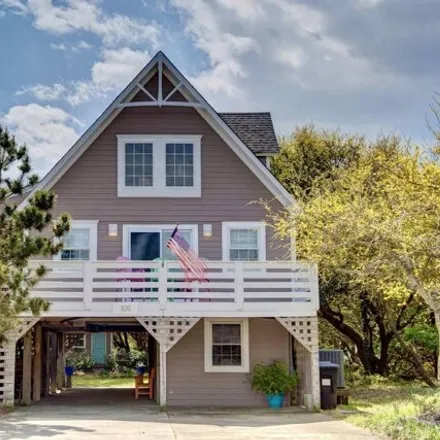
Welcome to this enchanting beach home nestled on an expansive11, 500square foot lot, graced by a unique and magnificent live oak tree! Step into a grand entry with soaring ceilings, and spacious living with 4 generously-sized bedrooms and 3 full bath...
$499,900
$499,900
Available: Right Now
Situated in the Avalon Soundside community, this cute home features one level living, open floor plan and so many extras. Besides having no stairs to climb, home features a sun room, back deck, nice storage bldg/workshop in the large fenced in back y...

$1,8M
$1,8M
Available: Right Now
Centrally located to everything in the OBX, this gorgeous oceanfront property has sweeping panoramic ocean views and has been entirely updated! This home is completely turnkey with new cedar-impression vinyl siding, new windows, and a new metal roof....
$639,000
$639,000
Available: Right Now
Feel the coastal magic as you step inside this 2 bedroom, 2 bath oceanfront condominium with mesmerizing ocean views. Located in the heart of Kill Devil Hills, this First Flight Retreat ground level luxury condo offers a fresh and airy open floor pla...

$599,000
$599,000
Available: Right Now
Welcome to this gorgeous coastal home 3 bedroom 3 full bath open floor plan updated spacious kitchen that opens into the downstairs living area there is also a sitting/living area on the second floor so much space in the lovely Watersedge Community. ...
$557,000
$557,000
Available: Right Now
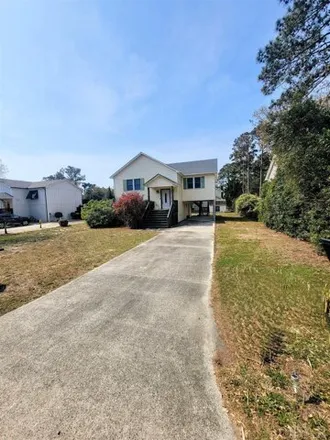
Welcome to Your Move-In Ready Primary or Second Home. Thoughtfully Landscaped to Nourish Body and Soul as Well as Pollinators. Berries, Figs, Peaches, Apples, Herbs and More Are Just Outside. Library/Study Entered from the Sundeck Is Perfect for A Ho...
$1,08M
$1,08M
Available: Right Now
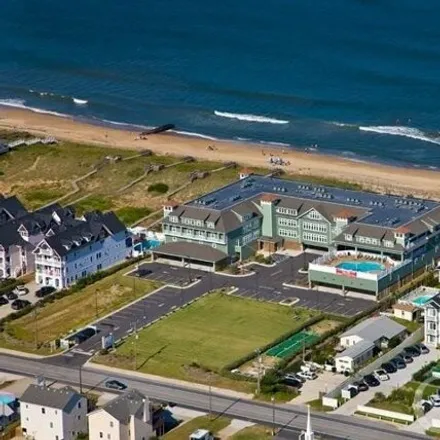
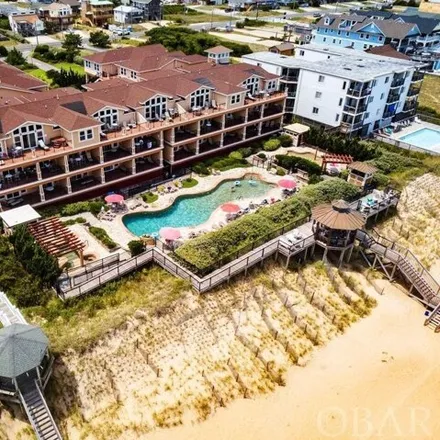
The Croatan Surf Club is a Prestigious Oceanfront Resort located on the Beautiful Beaches of the Outer Banks of North Carolina. This first class community boasts all the amenities one could desire for a fabulous beach vacation. This 3 bedroom/3 bath ...

$860,000
$860,000
Available: Right Now
Oceanside with deeded access! Until it was purchased in the fall of 2018 it had been a one owner home. When it was purchased, it had just been updated including new pilings, new central heat/ac with a 10 year warranty, new kitchen cabinets and applia...
$495,000
$495,000
Available: Right Now
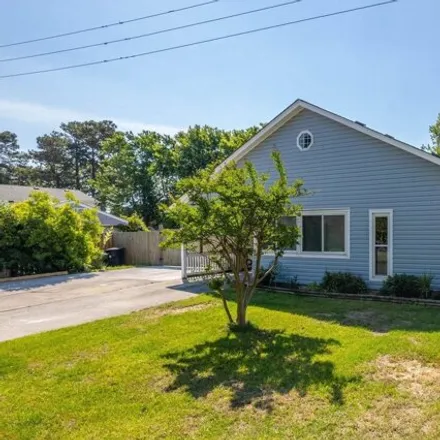
Looking for a well-maintained Outer Banks home that is located in the heart of the Outer Banks?! Then look no further, as this 3-bedroom, 2-bathroom home is only minutes to the Atlantic Ocean, Albemarle Sound, and newly built Wawa, Target, Movie Thea...
$754,999
$754,999
Available: Right Now
The Pinehurst truly stands out as an exceptional residence, boasting a wealth of high-end features and a meticulously crafted layout. The four bedroom, 3.5 bath home with a two car garage is perfect amount of space. The open-concept design creates a ...
$729,900
$729,900
Available: Right Now
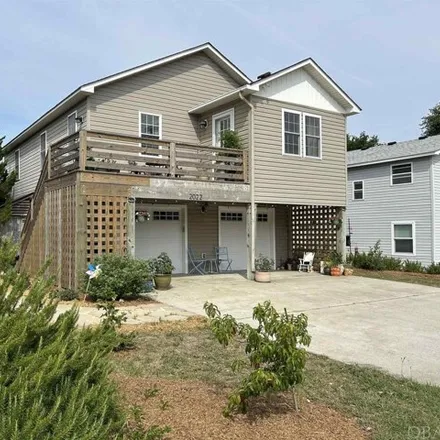
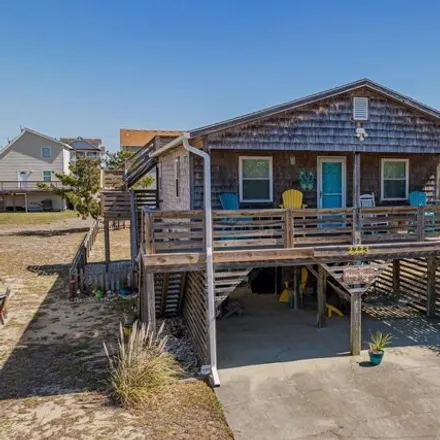
Discover the charm of coastal living at its best with this beautifully remodeled 3-bedroom, 2-bath cottage, perfectly nestled on a serene street just two lots from the ocean. Coming in 2024 a New fortified roof. You are so close that the sooth...

$525,000
$525,000
Available: Right Now
Nestled in the heart of Kill Devil Hills, this exquisite semi-oceanfront beach condo offers the perfect blend of comfort and convenience. With quick access to the beach via Calvin or Clark Street, this location is ideal for beach overs. The interior ...
$449,500
$449,500
Available: Right Now
3 Bedroom 3.5 Bath Desirable Private Corner Unit with New Front Decking and Stairs. This Unit has an Open Floor Plan with large Eat In Kitchen with Bistro Table for Two, Granite Counters and New LVP Flooring throughout third floor and Hallways. Livin...

$799,000
$799,000
Available: Right Now
Central Bay Drive Location, Panoramic Water Views, multi-level, water-front decking, a completely open water-side yard for so many landscaping options, bulkheading, over 100k in recent renovations, and so much more, make this Sound-Front Outer Banks ...

$665,000
$665,000
Available: Right Now
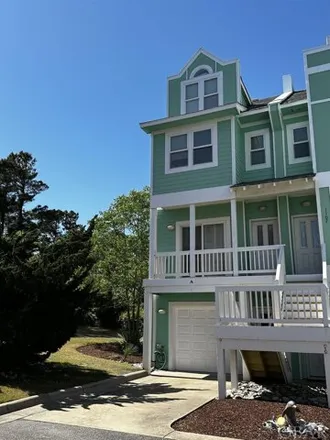
The stunning townhome , with easy beach access, would make a perfect primary or second home . highly coveted end unit with Additional windows and Added privacy ! The Gourmet kitchen and spacious pantry will ignite y...

$399,900
$399,900
Available: Right Now
Own your own piece of Paradise...2br/2.5ba1, 430sq ft townhouse style condo in a Resort Life Style Community. Entaining your guest will be a pleasure with the open kitchen/living area floor plan this unit has to offer. 2 Masters bedrooms with private...

$459,500
$459,500
Available: Right Now
One of the best locations in KDH with 30' elevation and potential for amazing ocean views! This classic design features a sunlit, south-facing screened porch, climate-controlled sun room and ample interior space. A versatile 10x14 addition at the rea...

$524,999
$524,999
Available: Right Now
Welcome to your turnkey retreat in the heart of Kill Devil Hills! This immaculate 2-bedroom, 2.5-bath single-family condo offers the perfect blend of comfort, convenience, and style. Step inside to discover a spacious open floor plan flooded with nat...
$660,000
$660,000
Available: Right Now
Memorable beach getaways demand the perfect location and this updated 3-bed, 2-bath beach box in the central Avalon area of Kill Devil Hills fits the bill to a T. Within walking distance of such iconic places as Avalon Pier and Awful Arthur's Oyster ...
$749,900
$749,900
Available: Right Now
This charming renovated cottage is centrally located in the heart of Kill Devil Hills, just a short distance to the public beach access. Enjoy 3 bedrooms and 2 full baths upstairs, and a separate ground-level unit with 1 Bed, a full bathroom, and kit...
Kill Devil Hills
According to statistics, the population in Kill Devil Hills, NC amounts to 6,978, which shows decline 0% compared to the previous year. The median age of the city’s residents is 39. The average household income is $50,898, shifting growth 5% from the past year, and the average property value in Kill Devil Hills, NC growth 2% to $240,200 throughout the year.
Household Income
The average household income in Kill Devil Hills, NC grew from $48,517 to $50,898 in the past year. This data is an estimate based upon 2,938 households in Kill Devil Hills, NC . The chart below presents how household income is distributed in Kill Devil Hills, NC in comparison to the revenue allocation amid households nationally.
Property Value
According to data from last year, the average property value in Kill Devil Hills, NC shifted from $234,900 to $240,200 throughout the year. The subsequent graph indicates the share of properties in the given price range in Kill Devil Hills, NC in comparison to the median property value in the same price segment across the country. According to the data, the greatest share of Kill Devil Hills, NC properties falls in the '$250,000 to $299,999' range, which is lower than the most significant median property across the country.
Property Taxes
One of the most important aspects for property owners is the amount of property taxes. This graph shows distribution of property taxes in Kill Devil Hills, NC compared to median property taxes around the country. The prevalent amount of property taxes in Kill Devil Hills, NC equals $1150, which is less than the national average.