Kingston, NY 12401, USA apartments for sale

$435,000
$435,000
Available: Right Now
Introducing 26 Amsterdam, Kingston a stunningly renovated Ranch home ready for you to move right in. Just over six years ago, this property was gutted to the studs and completely rebuilt, featuring new insulation, electrical, plumbing, drywall, windo...

$389,000
$389,000
Available: Right Now
Welcome to your dream home in the heart of Kingston! This charming 3-bedroom, 1-bathroom residence is perfectly situated within walking distance of Kingston's vibrant Uptown Stockade District. Imagine starting your day with a stroll to one of the man...

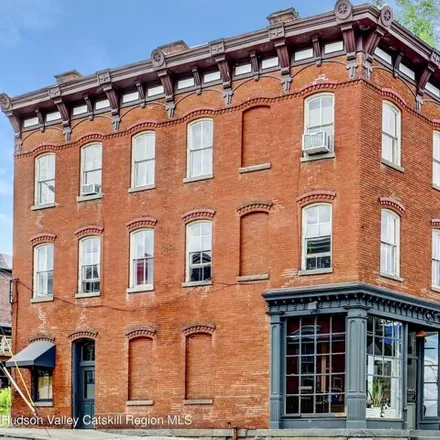
$450,000
$450,000
Available: Right Now
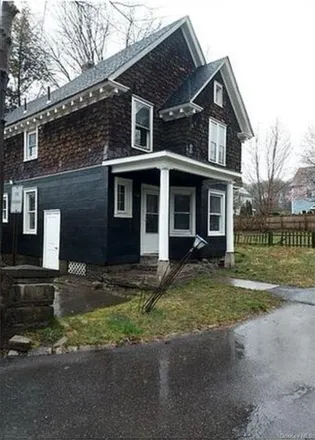
Located within walking distance to the picturesque Historic Waterfront District Hudson River Roundout, this property is nestled in a desirable neighborhood. This 1888 home used to be a corner store with upstairs living. It has been transformed into a...
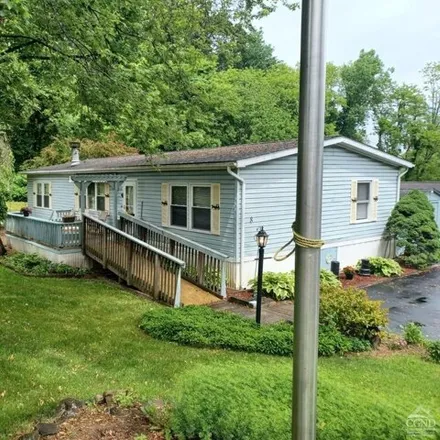
$124,999
$124,999
Available: Right Now
Well maintained 3 bedroom 2 full bath double wide mobile home in Connelly Terrace mobile home park. This is a 1989 Skyline 28' x 56'. Updates over the past 5 to 7 years include furnace, water heater, central air, carpeting, windows and appliances. Th...

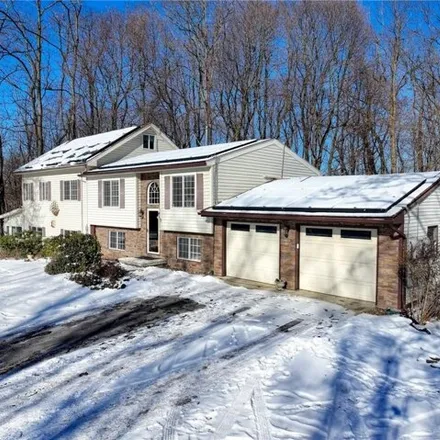
$325,000
$325,000
Available: Right Now
Discover this wonderful Cape in the Town of Ulster, where convenience meets charm! This 3-bedroom, 1-bathroom home is beautifully maintained and move-in ready! Step inside to a cozy living space featuring hardwood floors and a gas fireplace, perfect ...

$499,000
$499,000
Available: Right Now
This unique two-story home, nestled in the Ponkchockie area of downtown Kingston, offers a rare blend of convenience and charm. With 3 bedrooms, 2 bathrooms, a full basement, and an attic, it provides ample space to spread out. Its prime location put...
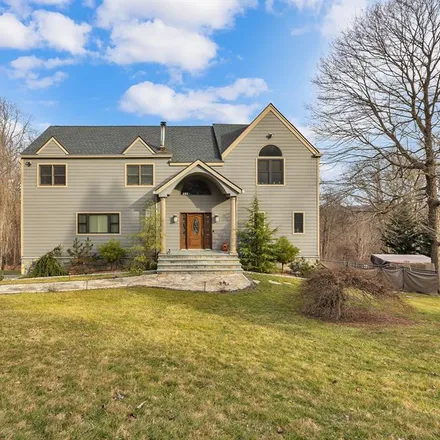
$895,000
$895,000
Available: Right Now
Introducing a stunning Colonial home that is sure to leave you mesmerized! Nestled on a peaceful cul-de-sac, this meticulously maintained property boasts over 2 acres of pristine property. With 4 bedrooms that can easily function as 5, a fabulous kit...

$375,000
$375,000
Available: Right Now
Great opportunity to own a two-family home on a quiet one way street in Kingston! Two one bedroom/one bath units, with separate entrances make this a great owner occupant start to growing a rental portfolio. Downstairs is vacant, freshened up and rea...

$399,000
$399,000
Available: Right Now
Stand Alone 1056 Sq.Ft. Building just outside the City of Kingston (very near to Uptown) easily converted to a Single Family Residence. Currently set up as a Chiropractor's Office with a Waiting and Reception Area, 5 Exam Rooms, Separate Two Room Sui...

$699,900
$699,900
Available: Right Now
This Beautiful Home has just recently been renovated, with all new windows, new electric hot water heater, new bathrooms, and new kitchen with all new appliances. Kitchen and bathrooms are beautifully finished with a contemporary esthetic while maint...
$1,19M
$1,19M
Available: Right Now
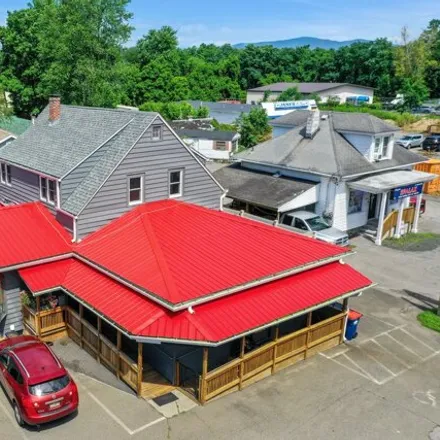
Welcome. Iconic 1885 Italianate mixed-use building in the heart of the Historic Rondout District in Kingston, NY. Three-unit, stately and stand-alone. Corner commercial storefront plus two residential units centered in the vibrant downtown neighborho...

$799,000
$799,000
Available: Right Now
Beautifully renovated Farmhouse is architecturally pleasing inside and out! Built in 1880, reborn in 2024, completely renovated with an eye to detail! Super Convenient location, walkable to everything Uptown/Stockade has to offer, Art, Restaurants, R...

$1,65M
$1,65M
Available: Right Now
Rare Opportunity on the Hudson River with Over 250 Feet of Unmatched Waterfront Access and a3, 400square foot MCM home! Discover a once-in-a-lifetime chance to own an extraordinary property boasting over 250 feet of pristine Hudson River frontage, fr...
$699,000
$699,000
Available: Right Now
Immerse yourself in the unique features that make this home special. Abrand-new roof, complete with solar panels. Step into a home that has been freshly painted and meticulously prepped for its new owners. The attention to detail and care are evident...

$465,000
$465,000
Available: Right Now
Welcome to Your Perfect Investment Opportunity! Located in the charming city of Kingston, NY, this three-family home offers an incredible investment opportunity for savvy buyers looking to capitalize on the city's thriving real estate market. Don't m...

$160,000
$160,000
Available: Right Now
HUD Owned, Over 1500 Sq Ft Cape Cod Home Consisting Of Two Bedrooms With Two Full Baths For Sale. Home Also Offers Two Levels, A Heated Screened In Porch, Combination Of Ceramic Tiled, Laminate and Wall To Wall Carpet Floorings, Laundry Room And More...

$359,900
$359,900
Available: Right Now
Six bedroom duplex located in city of kingston with off-street parking. located across street from pine street medical complex. there is separate parking for each unit with driveways on both sides of house. there are covered porches on the front o...
$925,000
$925,000
Available: Right Now
Take advantage of this exceptional opportunity to own a highly visible, mixed-use commercial property on bustling Ulster Ave in Kingston. This money-making investment boasts a prime location with high traffic counts, ensuring excellent exposure and a...

$399,000
$399,000
Available: Right Now
Welcome to a lovely 2 bedroom, one bathroom home located on a fabulous street in the charming town of Kingston. Perfectly situated with walkability to uptown Kingston, with no through traffic, this peaceful and private neighborhood is sure to be the ...
$390,000
$390,000
Available: Right Now
Welcome to your tranquil sanctuary in the heart of Kingston! This charming home offers a serene retreat from the hustle and bustle, nestled in a peaceful neighborhood surrounded by lush greenery and rich historical sites. Enjoy relaxing evenings on t...

$370,000
$370,000
Available: Right Now
Enjoy a magnificent view of the Hudson River from this pristine unit perched on top of the hillside. This multi-level unit features a spacious master bedroom suite complete with double California closets and a ceramic-tiled bathroom. The open-concept...

$325,000
$325,000
Available: Right Now
Beautifully Renovated Home awaits it's new occupants. So close to the water (2-3 minute drive) with Marina, kayak and boat rentals and so much more. Historical Kingston with so much to see, this lovely neighborhood awaits you. More photos coming soon...
Kingston
According to statistics, the population in Kingston, NY amounts to 23,419, which shows decline 0% compared to the previous year. The median age of the city’s residents is 38. The average household income is $45,487, shifting growth 5% from the past year, and the average property value in Kingston, NY decline -1% to $165,400 throughout the year.
What is the Average Price of Apartments for Sale in Kingston, NY, 12401?
| Month | Median Price |
|---|---|
| Jun 2024 |
$449,980
|
| May 2024 |
$502,182
|
| Apr 2024 |
$436,714
|
| Mar 2024 |
$436,714
|
| Feb 2024 |
$436,714
|
| Jan 2024 |
$436,714
|
| Month | Median Price |
|---|---|
| Jun 2024 |
$582,533
|
| May 2024 |
$581,814
|
| Apr 2024 |
$651,738
|
| Mar 2024 |
$651,738
|
| Feb 2024 |
$651,738
|
| Jan 2024 |
$651,738
|
Household Income
The average household income in Kingston, NY grew from $43,511 to $45,487 in the past year. This data is an estimate based upon 9,461 households in Kingston, NY . The chart below presents how household income is distributed in Kingston, NY in comparison to the revenue allocation amid households nationally.
Property Value
According to data from last year, the average property value in Kingston, NY shifted from $167,000 to $165,400 throughout the year. The subsequent graph indicates the share of properties in the given price range in Kingston, NY in comparison to the median property value in the same price segment across the country. According to the data, the greatest share of Kingston, NY properties falls in the '$150,000 to $174,999' range, which is lower than the most significant median property across the country.
Property Taxes
One of the most important aspects for property owners is the amount of property taxes. This graph shows distribution of property taxes in Kingston, NY compared to median property taxes around the country. The prevalent amount of property taxes in Kingston, NY equals $3000, which is less than the national average.