Laurinburg, NC 28352, USA apartments for sale

$500,000
$500,000
Available: Right Now
Welcome to your own slice of rural paradise! This 4-bedroom, 3-bathroom home is a homesteader's dream come true, offering everything you need to embrace a self-sufficient lifestyle. Beat the summer heat in your very own private pool. Keep your own fl...
$200,000
$200,000
Available: Right Now
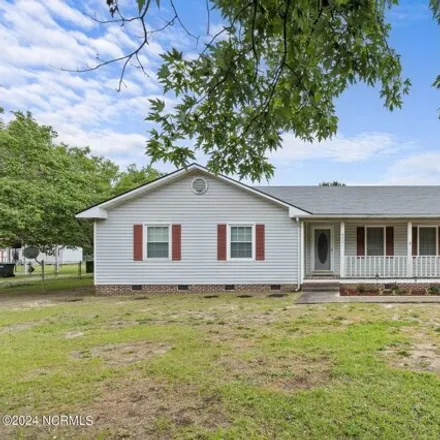
This delightful 3-bedroom, 2-bathroom property offers comfort, convenience, and modern amenities that will capture your heart. Step onto the inviting front porch, perfect for enjoying morning coffee or evening conversations with loved ones. As you en...

$99,000
$99,000
Available: Right Now
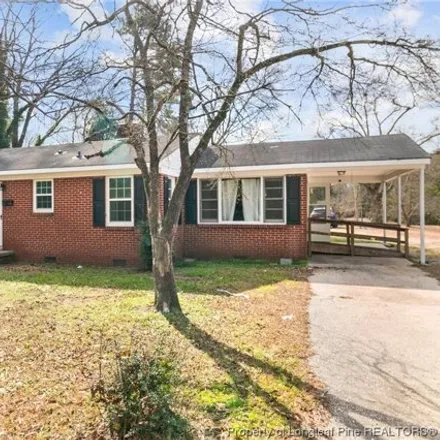
3BR 1.5BAall brick home located in Stewartsville Acres being sold As-Is. Established neighbors on each side and peaceful open field across thestreet. Located on an flat 1-acre lot, this home could be a blank canvas for a new owner to build onto for t...
$250,000
$250,000
Available: Right Now
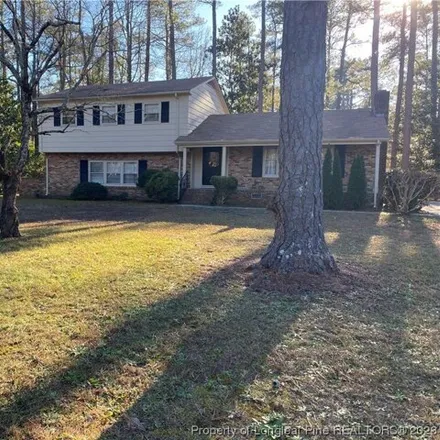
Nestled in a charming neighborhood, this timeless 4-bedroom, 3-bathroom split-level brick residence exudes character and classic design. The main level boasts a spacious living room with large windows, allowing natural light to flood the space. The k...
$209,900
$209,900
Available: Right Now
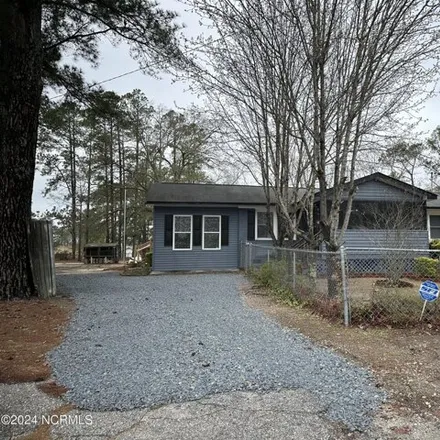
This beautiful remodeled home offers 3 beds 2 bath and a closed in garage that could be used as the 4th bedroom! Open floor plan with a built in bluetooth stereo system that would be perfect for entertaining! Granite countertops, LVP flooring through...
$389,000
$389,000
Available: Right Now
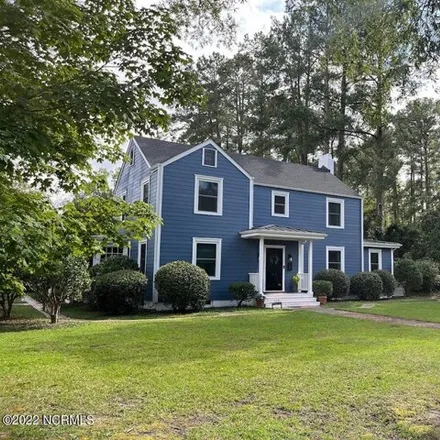
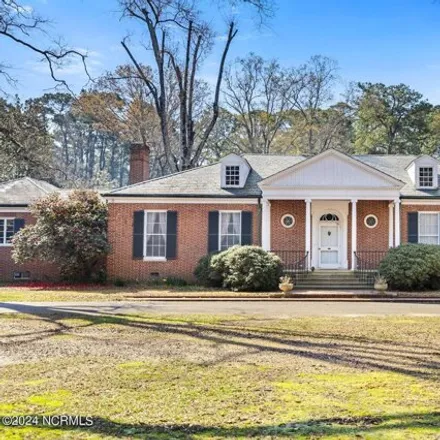
Lovely older home in quaint downtown area. Only 50 minutes from Ft. Bragg and easily accessible to highways and interstates. Beautifully renovated and move in ready. The home was built in 1940, professionally landscaped and the garage/apartment/stora...
$144,900
$144,900
Available: Right Now
Presenting the opportunity to own this USDA eligible 3 bedroom 2 bathroom updated ranch home located within the city limits of Laurinburg. This is the perfect starter home or investment property, as it provides comfort and convenience to any potentia...
$199,900
$199,900
Available: Right Now
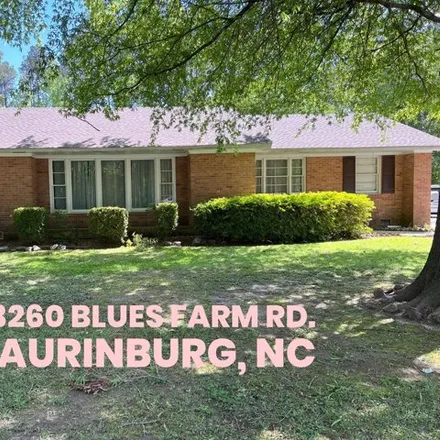
Nice brick ranch in great location, convenient to shopping, restaurants, and hospital. Home is setting on 2 lots and totals approximately 1 acre. The roof and HVAC unit have been recently replaced, home has original wood floors under most of the carp...
$235,000
$235,000
Available: Right Now
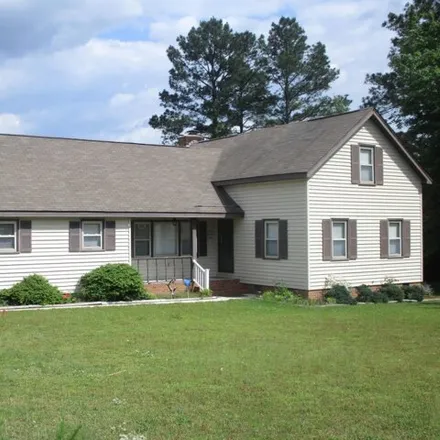
3 Bedrooms, 2.5 Baths, Living Room with Fireplace and gas logs, kitchen/dining room combo w/stove, refrigerator, dishwasher and laundry room. Screen back porch and covered deck, detached storage building and a one care garage attached. Nice large bac...

$79,900
$79,900
Available: Right Now
This affordable, charming two-bedroom, one-bath home presents an excellent opportunity for all! It's perfect for first-time buyers entering the housing market or investors seeking a solid rental property. Conveniently located just minutes from shoppi...

$97,500
$97,500
Available: Right Now
Welcome to this delightful two bedroom, one bath home that perfectly balances comfort and convenience. Nestled in a quaint neighborhood, this charming residence offers an ideal space for first time buyers or those looking to downsize without sacrific...

$925,000
$925,000
Available: Right Now
Luxurious Country Living - Custom Brick Estate on 14.8 Acres This stunning 4-bedroom custom brick home, nestled on a breathtaking 14.8-acre property is complete with a serene pond view. Upon arrival you'll be captivated by the mature landscaping and ...
$279,900
$279,900
Available: Right Now
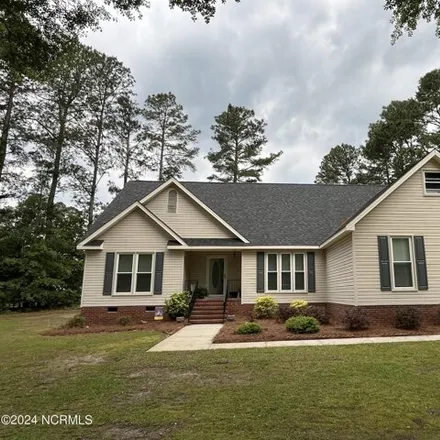
Over 2300 Square Feet with 3 bedrooms 2 baths both of which have been updated, great room with fireplace open to the kitchen and breakfast area and formal dining room. Some wood flooring, some LVP some Tile. Attached 2 car garage was converted into a...
$825,000
$825,000
Available: Right Now
Rarely does a home of this caliber enter the market. This historic home in Laurinburg, North Carolina, designed by renowned NC Modernist Architect Charles Connelly, is a remarkable blend of historical significance and modern luxury. Built in 1951, it...
$99,000
$99,000
Available: Right Now
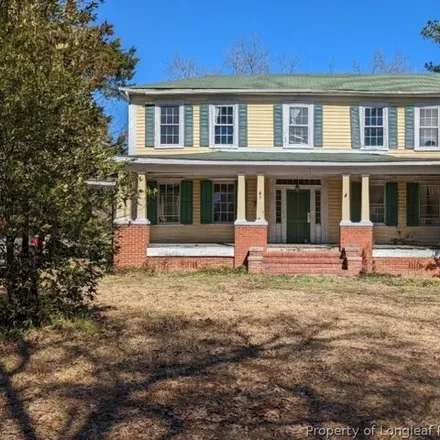
Investor Special, or those who love old houses!!! This historic home was built by a Civil War Gunsmith. So much history attached to this home, and can be beautifully restored with some TLC- so much potential! 4 bedrooms, office, storage room, plenty ...

$80,000
$80,000
Available: Right Now
Calling all investors! Conveniently located and sitting on a large lot. This 3 bedroom, 1.5 bath home in Laurinburg has a month-to-month tenant in place. Some features you'll love include the screened in porch, hardwood flooring, and beautiful firepl...
$295,000
$295,000
Available: Right Now
This one owner home is located in a quiet subdivision on a cul-de-sac lot. Low maintenance exterior, split floor plan, bonus room and fenced yard. Recent improvements include interior paint, roof, dishwasher and some flooring. Home has vinyl replacem...

$234,900
$234,900
Available: Right Now
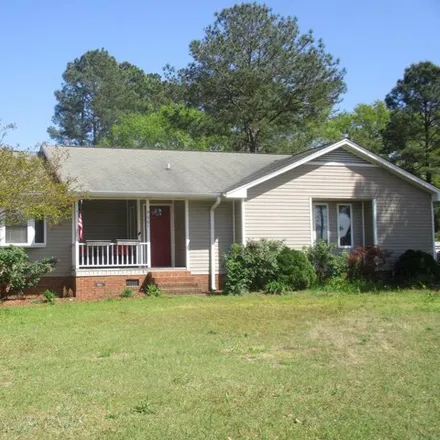
Beautiful remodeled home in a well established neighborhood. This home is located on a corner lot and has lots of room for all your outdoor activities! New LVP flooring throughout, Granite Countertops, tiled walk in showers and lots more! This is def...

$249,900
$249,900
Available: Right Now
Freshly painted 4 bedroom 3 bath home in convenient location. Large master bedroom suite. Enjoy the large family room which opens to screen porch. The oversized eat in kitchen is perfect for all those family times. Hardwood floors in much of the hous...

$69,900
$69,900
Available: Right Now
House for sale in/on/near 409 Cleveland St, Laurinburg, North Carolina, 28352. The price for this house is $69,900. This 1601-square-feet 3 bedroom house features 1 bathroom. Contact the agent to schedule an open house....

$59,900
$59,900
Available: Right Now
Great investment property with tenant already in place! Currently a 1 bed 1 bath but has another room that could easily be converted into an additional bedroom. Call today to schedule your private tour!...

$220,000
$220,000
Available: Right Now
This beautiful home was remodeled in 2020 and includes 3 bedrooms, 2 baths in a great neighborhood. A fenced backyard and back patio are perfect for entertaining....
Laurinburg
According to statistics, the population in Laurinburg, NC amounts to 15,320, which shows decline -2% compared to the previous year. The median age of the city’s residents is 38. The average household income is $28,187, shifting growth 8% from the past year, and the average property value in Laurinburg, NC decline 0% to $98,300 throughout the year.
What is the Average Price of Apartments for Sale in Laurinburg, NC, 28352?
| Month | Median Price |
|---|---|
| Jun 2024 |
$180,587
|
| May 2024 |
$164,575
|
| Apr 2024 |
$181,626
|
| Mar 2024 |
$181,626
|
| Feb 2024 |
$181,626
|
| Jan 2024 |
$181,626
|
Household Income
The average household income in Laurinburg, NC grew from $26,216 to $28,187 in the past year. This data is an estimate based upon 6,043 households in Laurinburg, NC . The chart below presents how household income is distributed in Laurinburg, NC in comparison to the revenue allocation amid households nationally.
Property Value
According to data from last year, the average property value in Laurinburg, NC shifted from $98,200 to $98,300 throughout the year. The subsequent graph indicates the share of properties in the given price range in Laurinburg, NC in comparison to the median property value in the same price segment across the country. According to the data, the greatest share of Laurinburg, NC properties falls in the '$100,000 to $124,999' range, which is lower than the most significant median property across the country.
Property Taxes
One of the most important aspects for property owners is the amount of property taxes. This graph shows distribution of property taxes in Laurinburg, NC compared to median property taxes around the country. The prevalent amount of property taxes in Laurinburg, NC equals $1150, which is less than the national average.