Louisburg, KS 66053, USA apartments for sale
$439,950
$439,950
Available: Right Now
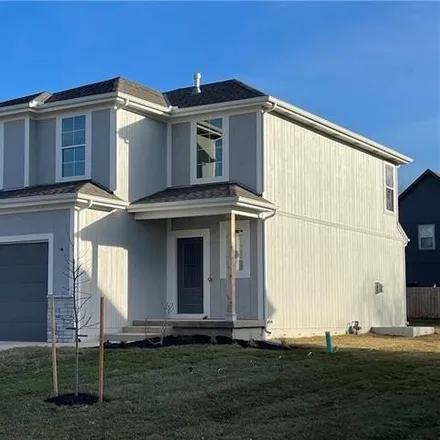
YourNEW HOMEin Louisburg is here and ready for buyers to make design selections on flooring, lighting, countertops, etc for a limited time! Let's discuss this planning for yourNEW HOME! This stunning New Construction - Abbott 2 story floor plan by ML...

$900,000
$900,000
Available: Right Now
Spectacular investment of 4 occupied Townhouse rentals in good condition, with reliable, committed tenants. Sq. ft. per unit is approximately1300-1450with bedrooms, 2 full baths. Including some appliances, attached garages, patios and some fencing. H...

$220,000
$220,000
Available: Right Now
Hard to find 3 bedroom, 2.5 bath, Townhome in Louisburg, KS. Over 1400sq feet of living area! Home is a two story with good income potential or perfect place to raise a family with a park right across the street! One car garage is attached to the hom...
$472,950
$472,950
Available: Right Now
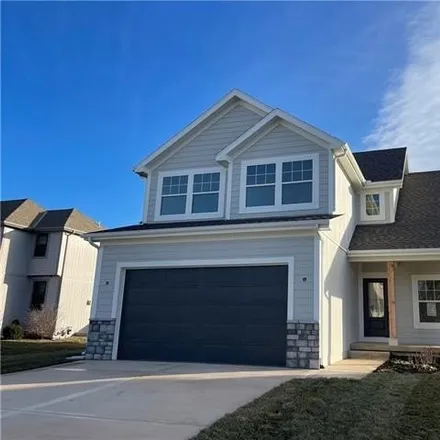
YourNEW HOMEin Louisburg is here and ready for buyers to make design selections on flooring, lighting, countertops, etc for a limited time! This stunning New Construction - Herndon 2 story floor plan by MLM Builders has superb craftsmanship, elegant ...

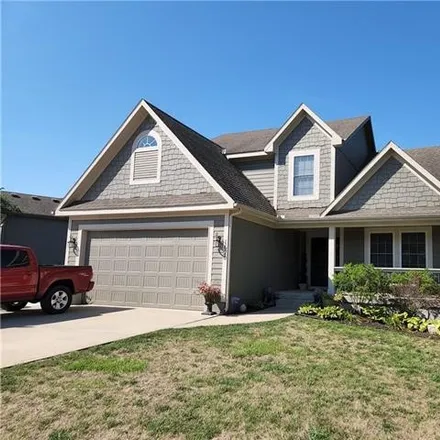
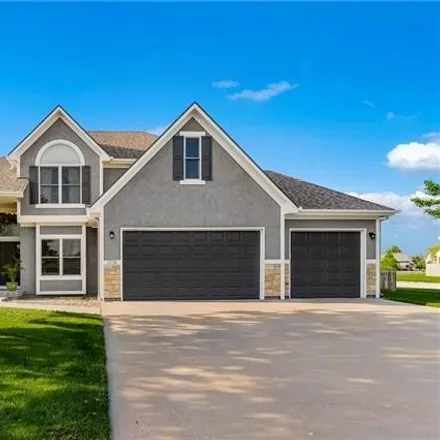
$415,000
$415,000
Available: Right Now
You'll instantly fall in love with this home. 4 bedrooms, 2.5 baths, 1.5 story with attached 2 car garage home in Louisburg. Built in 2022, this home has all the current features and finishes such as neutral color scheme, fireplace, wood floors, walk...

$410,000
$410,000
Available: Right Now
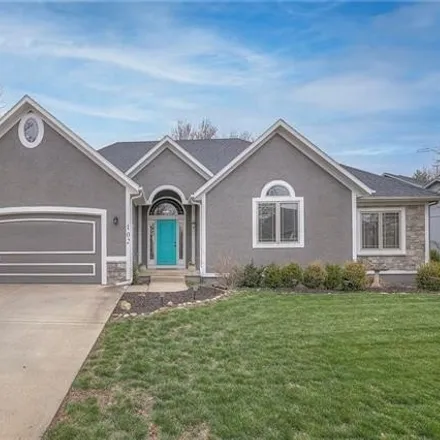
Prepare to be impressed !! This home has been updated within the last year to Perfection. All new paint inside and out, all new carpet, new granite countertops in the kitchen with a brand new stove and dishwasher. New faucets throughout...
$439,950
$439,950
Available: Right Now
Welcome to your serene retreat at The Lake of Louisburg! This picturesque ranch-style home boasts 4 bedrooms and 3 baths, offering ample space and comfort for your family. Step into the welcoming open floorplan of the main level, where natural light ...

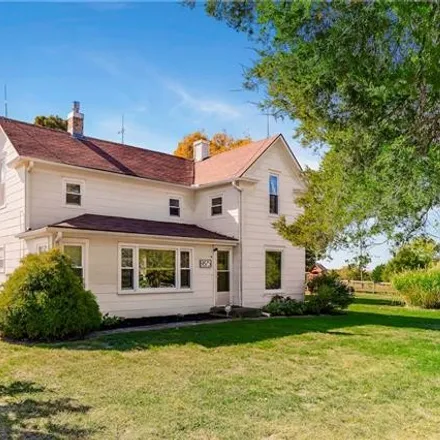
$575,000
$575,000
Available: Right Now
From the moment you pull in the drive, this property will feel like home to you. This 3-bedroom, 2 bathroom, 2 car garage home is perfectly situated on 6.35 acres m/l. Enter right into an open living area with vaulted ceilings and a stone fireplace, ...
$315,000
$315,000
Available: Right Now
Apartment for sale in/on/near 1205 North 3Rd Street East, Louisburg. The price for this apartment is $315,000. This 1971-square-feet 4 bedroom apartment features 3 bathroom. Contact the agent to schedule an open house....
$360,000
$360,000
Available: Right Now
Cute 4 Bedroom, 3 1/2Bath 2 Story Home in nice established neighborhood! Beautiful View of neighboring Lake! Nice Lot! Covered Front Porch w/metal spindles! Vaulted Living Room w/ Ceiling Fan. Pretty Kichen with Hardwood Floors, Custom Cabinets & Pan...
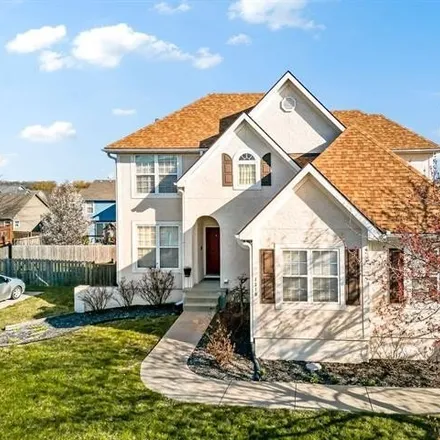
$398,000
$398,000
Available: Right Now
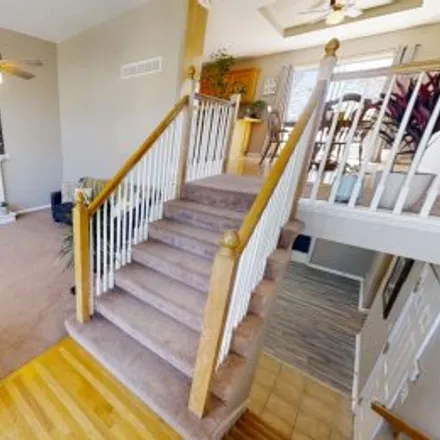
WE' Re back on the market with new carpet in bsmt, completed sheetrock and New paint in bsmt come check it out great 1.5 sty home with main floor master huge walk in closet in master awesome master bath with seperate shower and Jet t...
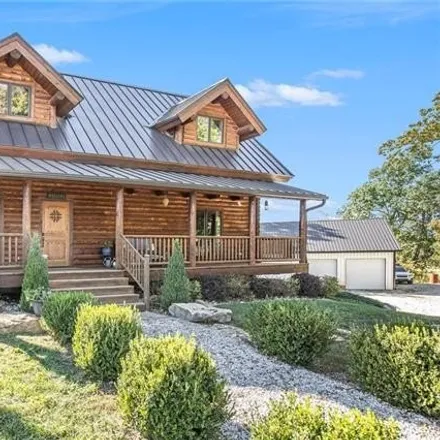
$675,000
$675,000
Available: Right Now
Ahhhh What's Not to love ? Ultimate in Seclusion, long driveway behind an electric gate you will find an enchantingly, unique, fun home, with a lovely front porch, a hugeSHOP, 30 X 40, 3Garage Bays, 1 tall enough for a car lift, concrete floor...
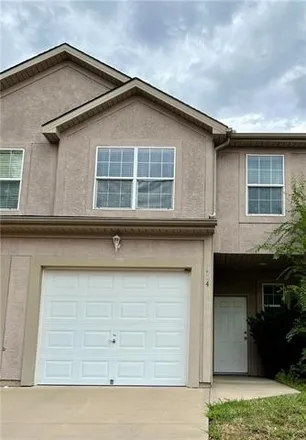
$189,950
$189,950
Available: Right Now
Spacious townhome accented by walk-in closets, bedroom level laundry, open concept living/dining/kitchen that walks out to private patio, great garage plus a light filled primary suite upstairs. Bask in the small town feels of Louisburg with convenie...

$475,000
$475,000
Available: Right Now
Looking for that cozy home on acreage where you can live, work, garden, and hunt? This property has a really nice oversized shop, a hunting shed in the timber and a huge garden to plant anything you desire! Cute 2 bedroom ranch that has been taken do...

$900,000
$900,000
Available: Right Now
Spectacular investment of 4 occupied Townhouse rentals in good condition, with reliable, committed tenants. Sq. ft. per unit is approximately1300-1450with bedrooms, 2 full baths. Including some appliances, attached garages, patios and some fencing. H...
$468,000
$468,000
Available: Right Now
Discover the perfect blend of elegance and functionality in this stunning 4-bedroom home, ideally situated on a prime lot within the desirable Hidden Creek community. This property exceeds the allure of new construction with its meticulously maintain...

$559,950
$559,950
Available: Right Now
Perfectly maintained and Beautifully updated ! Rare opportunity in a never before listed home! Views like no other ! This 4 bedroom, 4 bath expansive home has recently been updated with restained hardwood floors, new carpet, new ...
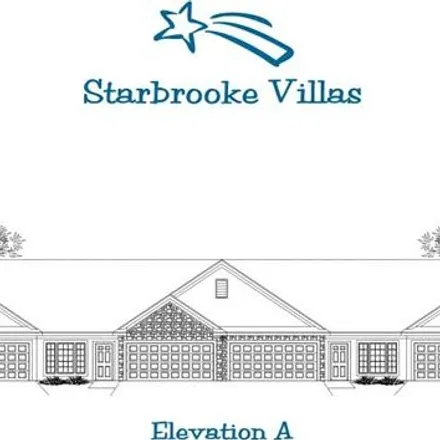
$219,000
$219,000
Available: Right Now
***Photos are of previous builds2 bedroom 2 bath RANCH villa located in 55+ community. Standard Features include: Shaker kitchen cabinets with soft close doors, Kitchen Island with breakfast bar, Master bedroom walk in closet, concrete patio, stu...
$1,75M
$1,75M
Available: Right Now
This could be your very own Picturesque Farmhouse Getaway, AirBnB or it is currently a workable cattle and hay farm just minutes from downtown. 72 Rolling Acres, 2 Stocked Ponds, Creeks, Barns, Wildlife and an updated 140-year-old Farmhouse. The enti...
Louisburg
According to statistics, the population in Louisburg, KS amounts to 4,347, which shows decline 1% compared to the previous year. The median age of the city’s residents is 36. The average household income is $56,859, shifting growth 12% from the past year, and the average property value in Louisburg, KS growth 3% to $162,300 throughout the year.
Household Income
The average household income in Louisburg, KS grew from $50,991 to $56,859 in the past year. This data is an estimate based upon 1,706 households in Louisburg, KS . The chart below presents how household income is distributed in Louisburg, KS in comparison to the revenue allocation amid households nationally.
Property Value
According to data from last year, the average property value in Louisburg, KS shifted from $158,100 to $162,300 throughout the year. The subsequent graph indicates the share of properties in the given price range in Louisburg, KS in comparison to the median property value in the same price segment across the country. According to the data, the greatest share of Louisburg, KS properties falls in the '$150,000 to $174,999' range, which is lower than the most significant median property across the country.
Property Taxes
One of the most important aspects for property owners is the amount of property taxes. This graph shows distribution of property taxes in Louisburg, KS compared to median property taxes around the country. The prevalent amount of property taxes in Louisburg, KS equals $2500, which is less than the national average.