Maumelle, AR 72113, USA apartments for sale

$349,900
$349,900
Available: Right Now
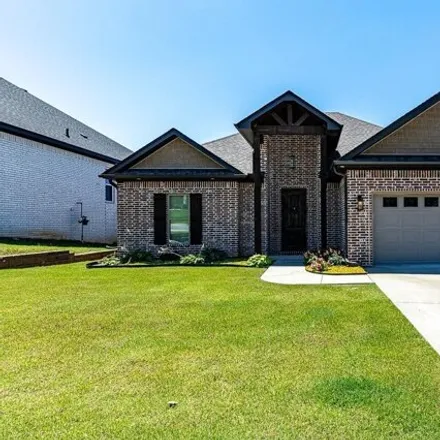
Immaculate custom-built traditional home with modern amenities! This3BR/2BAgem features an open floor plan, study, and a laundry room with sink. The stunning kitchen boasts upgraded granite countertops, abundant cabinetry, a breakfast bar, island, st...

$420,000
$420,000
Available: Right Now
Welcome to your dream home in the desirable Country Club of Arkansas subdivision! This stunning property features a primary bedroom separate from three additional bedrooms, offering privacy and comfort for everyone. Enjoy meals in the separate dining...
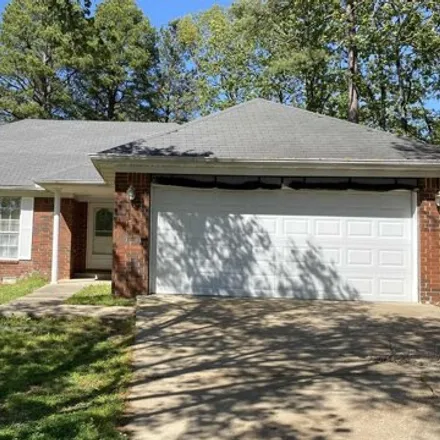
$215,000
$215,000
Available: Right Now
Opportunity to put your own touch on this 3 Bed 2 Bath 2 Car Garage home in Maumelle. Open Floor Plan with Gas Fireplace. Dining Area. Kitchen Open to the Living Room. Kitchen Fridge to Convey. Two Pantries in the Kitchen. Laundry Area. Spacious Prim...

$1,15M
$1,15M
Available: Right Now
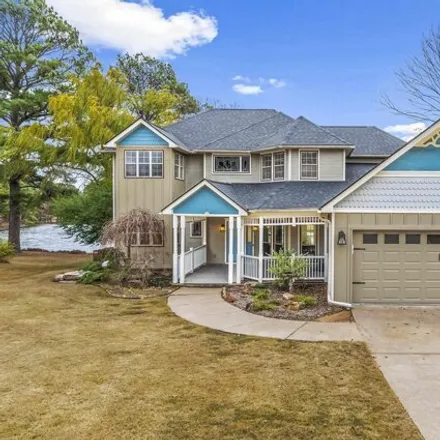
A RARE Find on the Arkansas River. This beautiful home has 3 Bedrooms/3 Baths on 4.17 acres. The main level has the wonderful large living room, dining area, sun room, kitchen, primary suite with his and her baths, guest suite, laundry, and office. U...
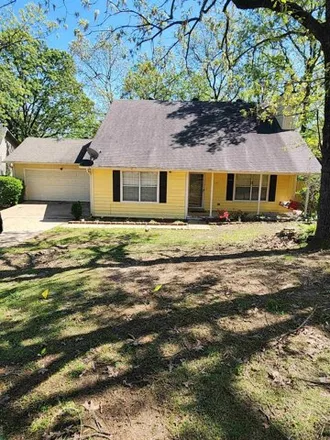
$270,000
$270,000
Available: Right Now
Welcome to the market this charming home located in a desirable Maumelle cul-de-sac with 4 bedrooms and 2.5 bathrooms, a gas log fireplace in the living room, built-ins throughout. Great backyard with a deck. All at 2052 sqft. Has so much potential f...

$465,000
$465,000
Available: Right Now
Welcome to your dream home nestled in the heart of nature! This stunning walk-out basement style home offers the perfect blend of modern comfort and serene green space. With 4 spacious bedrooms, 3 bathrooms, and an open concept living/dining/kitchen,...
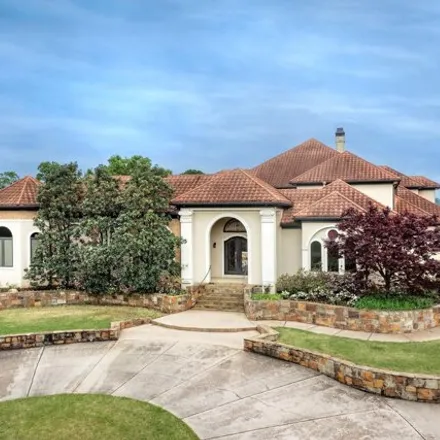
$1,65M
$1,65M
Available: Right Now
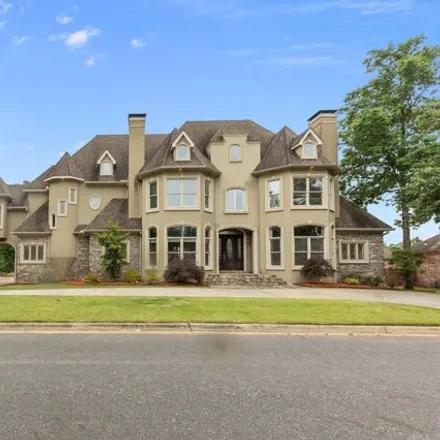
Splendid estate situated on 2.38 acres in a small gated community with views of the AR river from every window in the back of the home. Stunning features include grand 2 story entry with a curved staircase, Swarovski crystal chandeliers, coffered cei...
$310,000
$310,000
Available: Right Now
Nestled at 24 Yazoo Circle, Maumelle, AR, this remarkable property presents a spacious and inviting home encompassing3, 275square feet of living space. As you step inside, you'll be greeted by an expansive open living area, creating an ideal setting ...

$465,000
$465,000
Available: Right Now
Don't miss this pristine Brick home featuring an estimated 700 sq. ft. Game Room and many updates. Enjoy the elegance of Beautiful crown molding and High ceilings throughout. The Master Bedroom and Bath is Stunning, and all bedrooms are spacious and ...

$417,000
$417,000
Available: Right Now
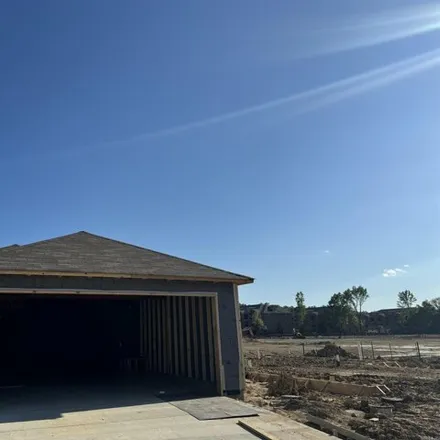
New construction - This 3 bedroom 2 bath home with an open floor plan is situated in the coveted Maumelle Valley Estates and is only a short drive to shopping and restaurants. The estimated completion is late July 2024. We are excited for you ...

$219,100
$219,100
Available: Right Now
The cute Cooper plan offers a beautiful open concept plan. The Master Bedroom in this home is spacious and is set to the rear of the home for added privacy. Come tour it today! Valuable upgrades included by designer: soaker tub/shower in Master Bath,...

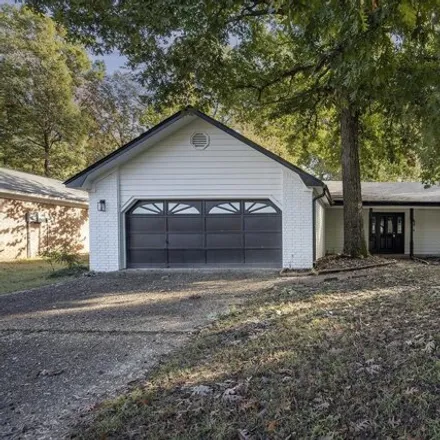
$239,900
$239,900
Available: Right Now
Nestled in the heart of a Maumelle and close to everything Maumelle has to offer. This 3 bed 2 bath home offers the blend of modern comfort and timeless charm. Entering the home, you are greeted with a large living room featuring a Cathedral Ceiling ...
$230,000
$230,000
Available: Right Now
Come check out this lovely Ridgeland plan! This pretty home has a modern look and sleek brick detailing in the front. The offset front door creates an entry that is perfect for removing wet shoes and placing dripping umbrellas. The front hallway welc...

$284,900
$284,900
Available: Right Now
Discover your dream home in Maumelle! This charming traditional house, nestled in a serene cul-de-sac, boasts numerous updates. It features 4 spacious bedrooms and 3 baths, with an extra living/bonus room upstairs. The layout includes two bedrooms on...

$389,000
$389,000
Available: Right Now
Gorgeous home in The Country Club of Arkansas! This home offers 4 bedrooms close to the course. Two beautiful living spaces separated by a double-sided fireplace. The large living room area opens to a huge level backyard and patio, fully fenced and p...

$655,000
$655,000
Available: Right Now
Welcome to 114 Timberland Trail, a stunning 4-bedroom, 3.5-bathroom home spanning3, 185sq. ft. This spacious residence boasts a versatile flex space, perfect for a playroom or additional living area, and a dedicated office space for all your work-fro...
$1,13M
$1,13M
Available: Right Now
Custom showcase home on golf course at Maumelle Country Club with oversized windows. A gourmet kitchen w/dual fuel Viking range, hibachi grill, sub-zero refrigerator and butler's pantry. Master has a fireplace and private access to pool. En-suite has...

$499,000
$499,000
Available: Right Now
Welcome to your dream home nestled in the heart of nature! This stunning walk-out basement style home offers the perfect blend of modern comfort and serene green space. With 4 spacious bedrooms, 3 bathrooms, and a versatile flex space downstairs, thi...

$439,900
$439,900
Available: Right Now
Welcome to the epitome of luxury living in the prestigious Country Club of Arkansas's newest phase! This stunning under-construction home boasts four bedrooms, two bathrooms, a three-car garage, and 2086 sq. ft. of exceptional living space. ?? Curren...
$530,000
$530,000
Available: Right Now
Welcome home to the only Victorian style house on Maumelle Country Club. This 4 bedroom 3.5 bathroom house has skyscraper height ceilings in the main living room area. The kitchen has gas range, breakfast bar, pantry, and double oven. The primary sui...

$224,200
$224,200
Available: Right Now
The Mitchell plan is a sweet plan that uses every square foot of space efficiently! This plan has a spacious Living Room and a built-in covered patio! Come tour it today! Thoughtful upgrades in this home: plumbing faucet upgrade 2, 8 deep Kitchen sin...
$361,600
$361,600
Available: Right Now
Charming home in Maumelle Valley Estates boasts a delightful open floor plan with no carpet throughout. Enjoy a spacious living area with a stunning high ceilings and gas log fireplace. The Living room. dining room and kitchen are all open to each ot...
Maumelle
According to statistics, the population in Maumelle, AR amounts to 17,967, which shows decline 1% compared to the previous year. The median age of the city’s residents is 40. The average household income is $72,335, shifting decline -8% from the past year, and the average property value in Maumelle, AR decline 1% to $220,600 throughout the year.
What is the Average Price of Apartments for Sale in Maumelle, AR, 72113?
| Month | Median Price |
|---|---|
| Jun 2024 |
$331,625
|
| May 2024 |
$263,095
|
| Apr 2024 |
$280,186
|
| Mar 2024 |
$280,186
|
| Feb 2024 |
$280,186
|
| Jan 2024 |
$280,186
|
| Month | Median Price |
|---|---|
| Jun 2024 |
$403,802
|
| May 2024 |
$323,356
|
| Apr 2024 |
$315,306
|
| Mar 2024 |
$315,306
|
| Feb 2024 |
$315,306
|
| Jan 2024 |
$315,306
|
Household Income
The average household income in Maumelle, AR declined from $78,779 to $72,335 in the past year. This data is an estimate based upon 7,520 households in Maumelle, AR . The chart below presents how household income is distributed in Maumelle, AR in comparison to the revenue allocation amid households nationally.
Property Value
According to data from last year, the average property value in Maumelle, AR shifted from $218,700 to $220,600 throughout the year. The subsequent graph indicates the share of properties in the given price range in Maumelle, AR in comparison to the median property value in the same price segment across the country. According to the data, the greatest share of Maumelle, AR properties falls in the '$200,000 to $249,999' range, which is higher than the most significant median property across the country.
Property Taxes
One of the most important aspects for property owners is the amount of property taxes. This graph shows distribution of property taxes in Maumelle, AR compared to median property taxes around the country. The prevalent amount of property taxes in Maumelle, AR equals $3000, which is less than the national average.