Milbank, SD 57252, USA apartments for sale

$49,900
$49,900
Available: Right Now
Showings start wednesday june 19th. this bank owned home that was formerly a duplex is being sold ''AS IS''. Each side of the home features 2 bedrooms and 2 bathrooms. So here is the story with this place. It was once a beautiful...
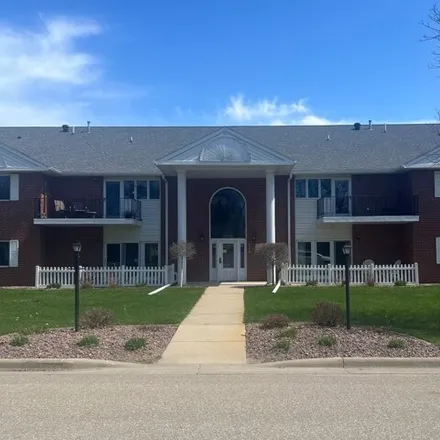
$169,900
$169,900
Available: Right Now
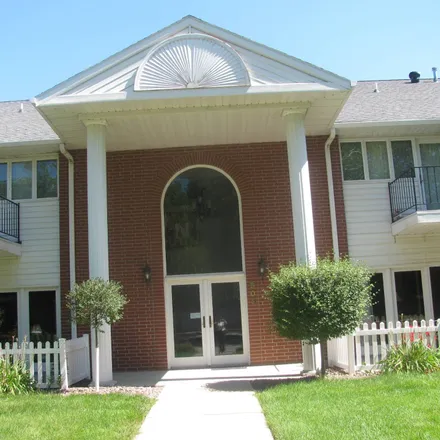
Unit 7 in the Carriage House Condo's features a galley kitchen with hardwood floors, a pantry/utility room, and a pass-through window to the living room for easy entertaining and views. The dining area opens to the oversized living room with a cozy n...

$259,000
$259,000
Available: Right Now
This 5 bedroom 3 bath home in a very desirable location has been priced for immediate sale! It features a chefs dream kitchen with cupboards galore and a gas stove. Kitchen includes16 X 16dining room with pass through. Dining side has an additional d...
$659,000
$659,000
Available: Right Now
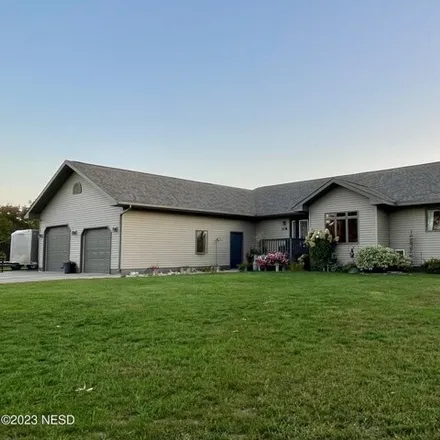
Welcome to this beautiful ranch style masterpiece that sits on 1.7 acres, has city amenities but a country feel! It is located on the banks of the Whetstone Creek - but NOT in a flood plane! This property is a true gem - Built in 2012 with4, 431sq fe...

$399,000
$399,000
Available: Right Now
Located on a beautiful corner lot in Milbank SD, here is a home that has it all! This five bedroom, three bath home has a wonderful sense of space. The open concept living, dining, and kitchen sit under vaulted ceilings. There are three bedrooms, two...
$169,900
$169,900
Available: Right Now
Don't miss out on the adorable 3 bedroom, 3 bath home centrally located on a corner lot in Milbank. Enjoy spending time on the front porch or relax under the gazebo on the back deck. This home features an open living and dining room, updated kitchen,...
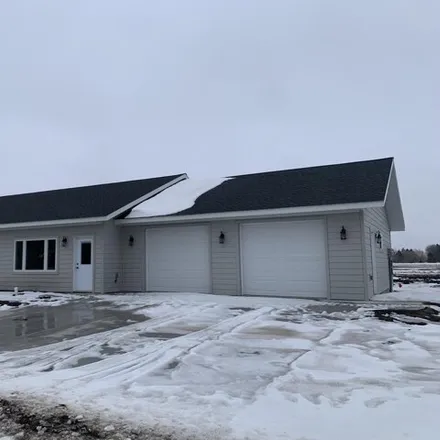
$448,000
$448,000
Available: Right Now
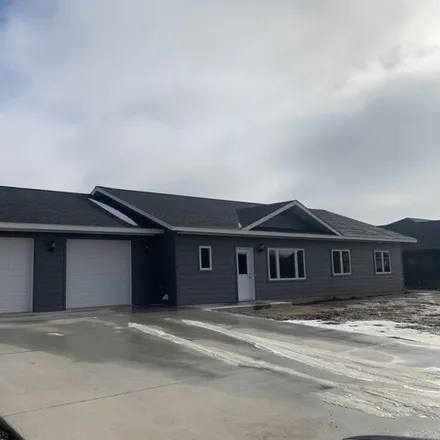
New development...zero entry single level living.... Put your personal stamp on this move-in ready 3 bedroom 2 bath home. This property boasts in-floor heat throughout the living area and fully finished garage. Offering 9 ft. ceilings, Anderso...
$799,900
$799,900
Available: Right Now
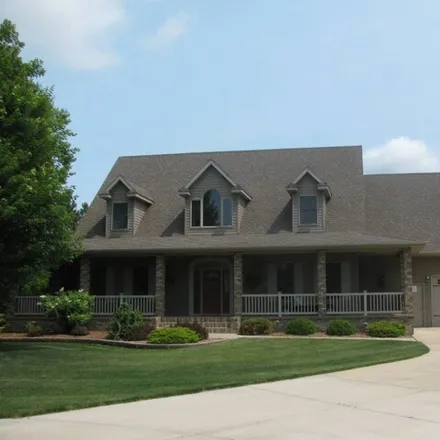
Quality and Location are standout features of this 5 bedroom, 4.5 bathroom property. Many custom features both inside and outside bring this property to the next level. Fantastic curb appeal and a large private backyard with all of the amenities to e...

$190,000
$190,000
Available: Right Now
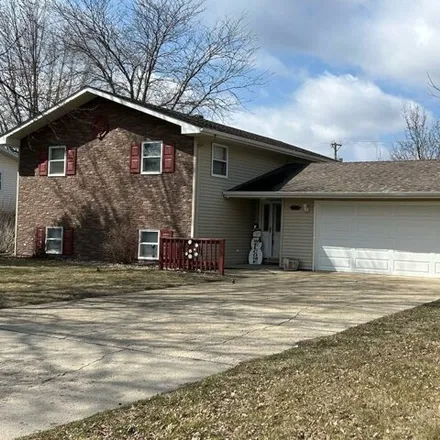
If size matters then this is the home for you !!! Pride of ownership shines throughout. Let me tell you what you will find just on the main floor of this huge home! Living room w/ hidden hardwood floors, eat-in kitchen, formal dining ro...
$599,000
$599,000
Available: Right Now
Thinking about a new career? You could own this successful turn key Residential Care Home business. It is fully furnished with 10 bedrooms, 9 bathrooms, 2 kitchens, 3 living rooms, large dining room, walk out lower level, 2 decks, concrete patio, own...
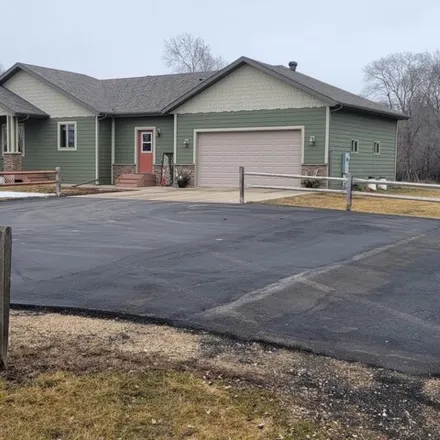
$269,900
$269,900
Available: Right Now
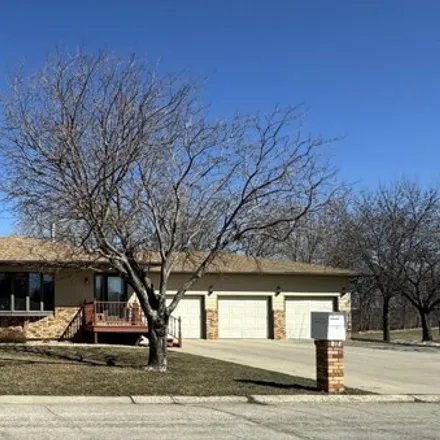
Walk into a nice entry way with large closet for coats and boots. Main floor there are 2 bedrooms, one with a master bathroom. Living room with gas fireplace. Eat in kitchen/dining room that is attached to a sun room with many possibilities. Lower le...
$439,000
$439,000
Available: Right Now
New development...zero entry single level living.... Put your personal stamp on this move-in ready 3 bedroom 2 bath home. This property boasts in-floor heat throughout the living area and fully finished garage. Offering 9 ft. ceilings, Anderso...
$215,000
$215,000
Available: Right Now
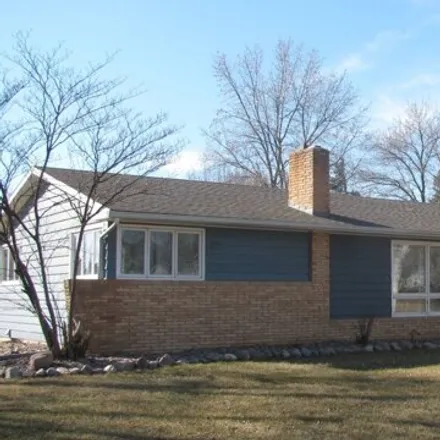
Great location! 2 large bedrooms on main floor and 1 non-conforming in the lower level. 2 bathrooms. New shingles in 2020, new kitchen and flooring on main level in 2018....
$399,000
$399,000
Available: Right Now
Motivated sellers ! This home is priced well below replacement cost. This 5 bedroom 3 bathroom home is a very rare find. It features cathedral ceilings, solid core doors, large primary suite, a separate office, huge family room big enough to r...

$122,250
$122,250
Available: Right Now
Bank Owned Listing Sold As-Is. Lots of original woodwork and character. Bring a tool kit and ideas to finish bringing this house back to life. Nice back deck and two stall garage. Please consult with your lender prior to looking at bank owned propert...
$195,000
$195,000
Available: Right Now
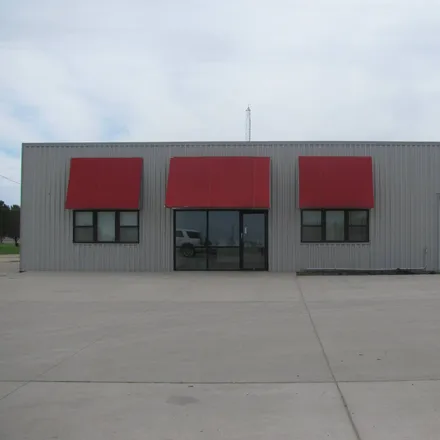
This Commercial Building is located on Highway 12 in the business district of Milbank on the East Side of town. It has been renovated in recent years, both inside and outside - (right down to the wiring- 200Aservice). It has nice built-ins, carpet, p...
$159,900
$159,900
Available: Right Now
Unit #10 in the Carriage House Condo features a Galley kitchen with tile flooring, large custom pantry, and pass-through window for easy entertaining. Dining area opens to the oversized living room with a small deck that catches the morning shade and...

$138,000
$138,000
Available: Right Now
This 4 bedroom 2 bathroom ranch just hit the market in milbank ! It has recently been painted through out, brand new carpet and An updated luxury bathroom. both main floor and Lower level laundry, attached garage and Ma...
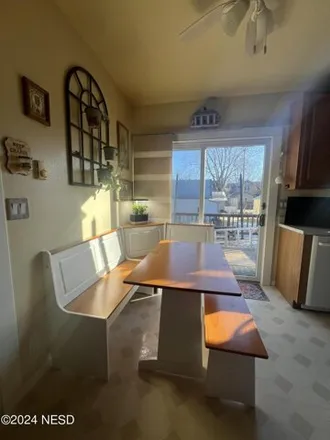
$215,500
$215,500
Available: Right Now
You will feel right at home the minute you walk in. The main floor features a spacious living room with play area and lots of natural light. Lower level bedroom with half bath and laundry. Large open kitchen with ample cupboards and counter space. Fo...
Milbank
According to statistics, the population in Milbank, SD amounts to 3,178, which shows decline -2% compared to the previous year. The median age of the city’s residents is 43. The average household income is $51,178, shifting growth 7% from the past year, and the average property value in Milbank, SD growth 1% to $108,200 throughout the year.
Household Income
The average household income in Milbank, SD grew from $47,974 to $51,178 in the past year. This data is an estimate based upon 1,483 households in Milbank, SD . The chart below presents how household income is distributed in Milbank, SD in comparison to the revenue allocation amid households nationally.
Property Value
According to data from last year, the average property value in Milbank, SD shifted from $107,100 to $108,200 throughout the year. The subsequent graph indicates the share of properties in the given price range in Milbank, SD in comparison to the median property value in the same price segment across the country. According to the data, the greatest share of Milbank, SD properties falls in the '$125,000 to $149,999' range, which is lower than the most significant median property across the country.
Property Taxes
One of the most important aspects for property owners is the amount of property taxes. This graph shows distribution of property taxes in Milbank, SD compared to median property taxes around the country. The prevalent amount of property taxes in Milbank, SD equals $1150, which is less than the national average.