Montague, CA 96064, USA apartments for sale
$955,000
$955,000
Available: Right Now
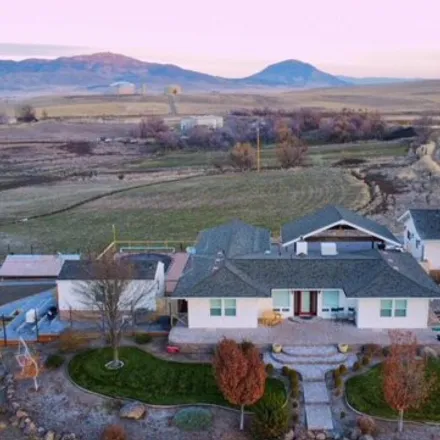
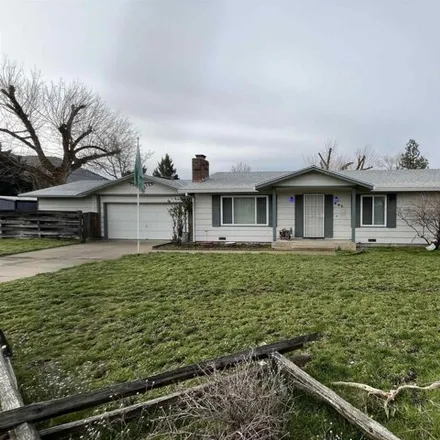
Beautiful country home on top of a hill W/ commanding views. 8+ acres with 360 views of Shasta Valley, Mt Shasta the Eddys and Black Butte, located mi East of Montague Proper. Remodeled in 2011 again in 2019. This home offers 3 bedrooms, (one current...
$229,900
$229,900
Available: Right Now
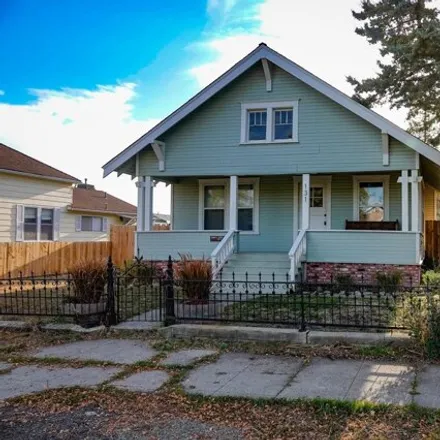
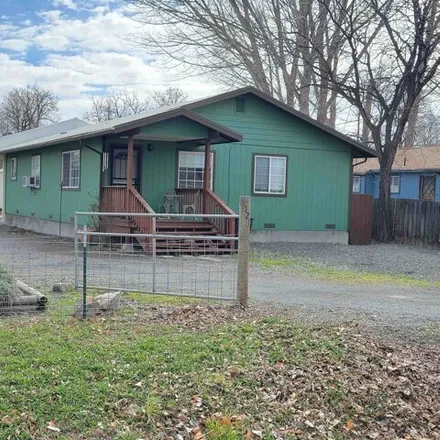
Enjoy the character and charm of this classic early 1900's 3 bedroom, 1 bath home in Montague! The home has been updated multiple times through the years. It has ac, a newer monitor heater in addition to the wood stove and newer water heater. The hou...
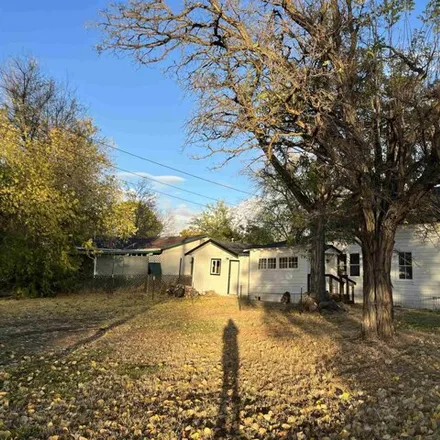
$180,000
$180,000
Available: Right Now
DON' T miss out on this home in a Nice neighborhood in town and on a big level lot! Could be a starter home or rental property. 3br/1ba has a mix of old and new; original hardwood flooring in front room, newer vinyl windows, and new met...
$316,900
$316,900
Available: Right Now
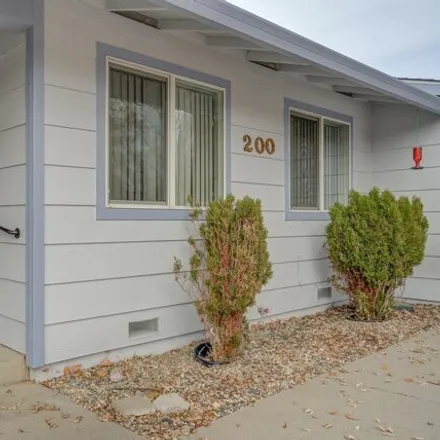
Welcome to this charming 5-bedroom, 2-bathroom house located at 200 5th Street. This property is ready to make your dreams come true with its abundance of space and fantastic features. As you step inside, you'll be greeted by a large living room ador...
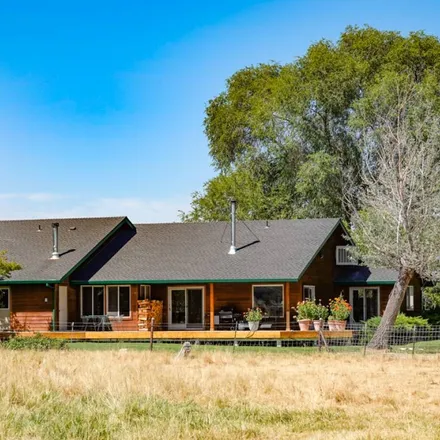
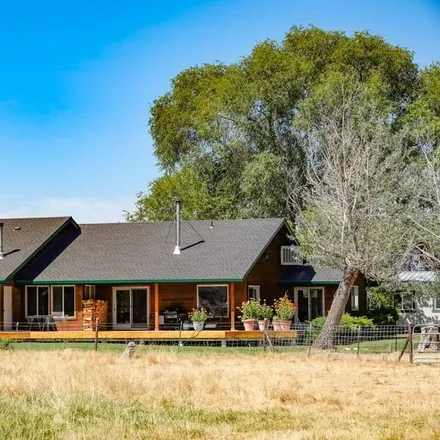
$980,000
$980,000
Available: Right Now
$164,500
$164,500
Available: Right Now
Welcome to 100 N 13th Street, Montague, CA. This quaint 1920s Era home has incredible character with recent renovation. A functional floorplan and a cozy wood stove make this a must see. The home features new carpet, tile and laminate flooring. This ...
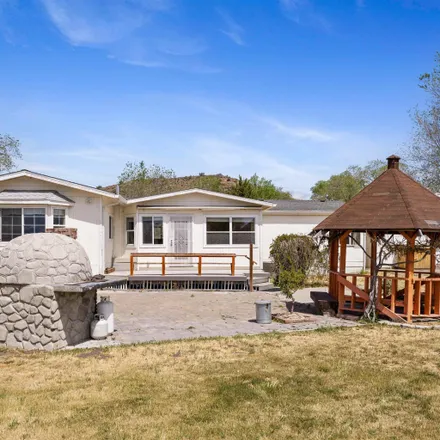
$225,000
$225,000
Available: Right Now
$980,000
$980,000
Available: Right Now
$275,000
$275,000
Available: Right Now
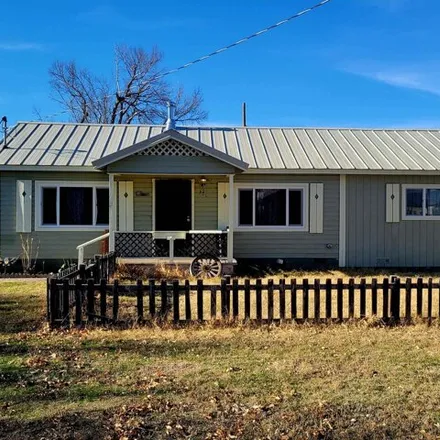
Charming 3 br 2 ba. home nested on a spacious.34-acre lot in the scene town of Montague. This well-maintained property offers a perfect blend of comfort and functionality, providing ample space for both indoor and outdoor living. The inviting living ...
$229,000
$229,000
Available: Right Now
Neat as a pin! This 2 bedroom, 2 bathroom home on a large Montague lot is move-in ready and cute as can be. Nice, open floor plan with large rooms and bathrooms. Oversized attached carport as well as a nice shed included. The lot is fully fenced and ...
Montague
According to statistics, the population in Montague, CA amounts to 1,385, which shows decline 1% compared to the previous year. The median age of the city’s residents is 38. The average household income is $45,845, shifting growth 9% from the past year, and the average property value in Montague, CA growth 3% to $122,700 throughout the year.
Household Income
The average household income in Montague, CA grew from $41,923 to $45,845 in the past year. This data is an estimate based upon 533 households in Montague, CA . The chart below presents how household income is distributed in Montague, CA in comparison to the revenue allocation amid households nationally.
Property Value
According to data from last year, the average property value in Montague, CA shifted from $119,300 to $122,700 throughout the year. The subsequent graph indicates the share of properties in the given price range in Montague, CA in comparison to the median property value in the same price segment across the country. According to the data, the greatest share of Montague, CA properties falls in the '$100,000 to $124,999' range, which is higher than the most significant median property across the country.
Property Taxes
One of the most important aspects for property owners is the amount of property taxes. This graph shows distribution of property taxes in Montague, CA compared to median property taxes around the country. The prevalent amount of property taxes in Montague, CA equals $1150, which is less than the national average.