Mound City, MO 64470, USA apartments for sale

$80,000
$80,000
Available: Right Now
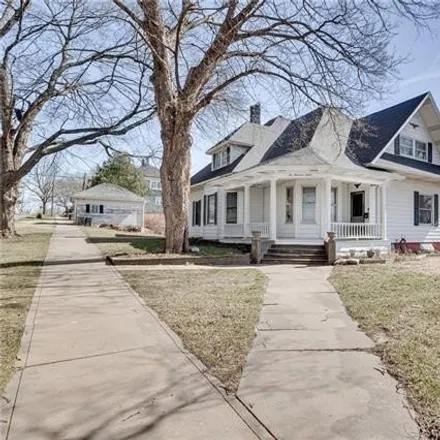
Unlock potential in Mound City with this investor's dream property: a prime 1-acre lot in a fantastic location, with a 2 bed, 1 bathroom home on it, featuring 2 garages, and additional outbuildings, this is an abundant space for future construction. ...
$289,000
$289,000
Available: Right Now
Look no further, beautiful and newly remodeled home in close proximity to the sought-after Mound City R2 School. You'll have all the space you need in this 6-bedroom, 2-bathroom home. Enjoy sitting on a large front porch and walk inside to find an op...

$89,000
$89,000
Available: Right Now
Welcome to this charming bungalow! As you step inside, you're greeted by the airy and spacious living area, perfect for relaxing or hosting gatherings with family and friends. The natural light streaming through the windows enhances the welcoming atm...

$168,500
$168,500
Available: Right Now
Looking for an adorable, yet affordable home with a large shed in the Mound City School District? Look no further! This 4 four bedroom, two bathroom home sits on a corner lot conveniently located near downtown. Enjoy gathering with family and friends...
$486,000
$486,000
Available: Right Now
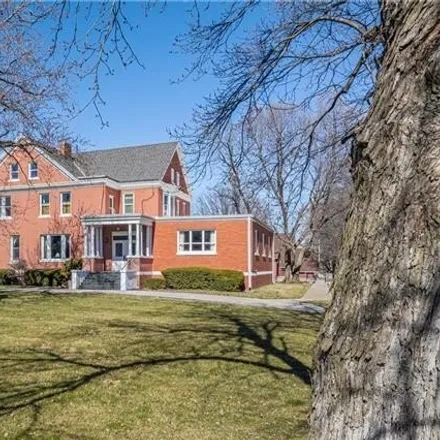
Welcome to 1405 Nebraska Street, Mound City, Missouri A property with diverse potential, accommodating a mix of commercial, residential, and multi-family uses, all situated on a sprawling 1.71-acre lot. From the moment you arrive, the commanding pres...

$275,000
$275,000
Available: Right Now
Cozy Ranch with 2 Car26 X 21Detached Garage (Insulated and Heated) and a Huge Detached34 X 22Two Stall Shop with Loft (Approx. 2 years Old and 240 plug in for camper ) ! Hardwoods Throughout...Kitchen with Custom Wood CabinetsHEATEDTile Floor,...

$380,000
$380,000
Available: Right Now
One of a kind! Back on the market - no fault of sellers. Radon Mitigation has recently been installed. Call Listing Agent Jan Seitz for more details. This 1920 Home has been fully restored andLIKE NEWfrom inside to out. Home features 5 bedroom...
$225,000
$225,000
Available: Right Now
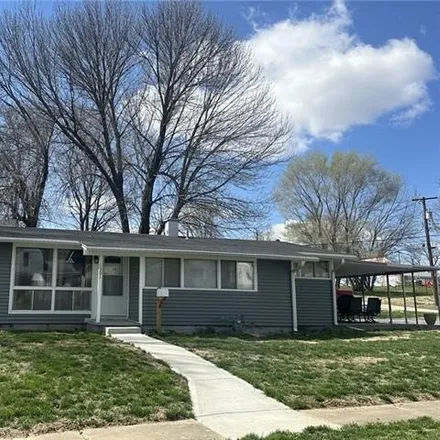
Discover the perfect blend of comfort and convenience in this charming residence nestled in the heart of Mound City, MO. Boasting 3 bedrooms with a potential for a 4th, one and a half baths, this all level ranch home offers effortless living. Situate...

$259,000
$259,000
Available: Right Now
Welcome to your new home in the heart of Mound City! 4-bedroom, 2-bathroom home with so many updates to love including new exterior paint, new kitchen countertops, kitchen sink and faucet, drywall in the kitchen with stylish floating shelves and back...

$165,000
$165,000
Available: Right Now
Charming 3 possible 4 bedroom, 3 full baths, eat in kitchen and great location right next to the school! This home offers newer roof, funace replaced with in the last 9 years, new windows replaced last 2 years and siding, Exterior door new, Plumbing ...
Mound City
According to statistics, the population in Mound City, MO amounts to 1,145, which shows decline -2% compared to the previous year. The median age of the city’s residents is 46. The average household income is $51,667, shifting growth 22% from the past year, and the average property value in Mound City, MO decline -1% to $95,000 throughout the year.
Household Income
The average household income in Mound City, MO grew from $42,396 to $51,667 in the past year. This data is an estimate based upon 544 households in Mound City, MO . The chart below presents how household income is distributed in Mound City, MO in comparison to the revenue allocation amid households nationally.
Property Value
According to data from last year, the average property value in Mound City, MO shifted from $96,100 to $95,000 throughout the year. The subsequent graph indicates the share of properties in the given price range in Mound City, MO in comparison to the median property value in the same price segment across the country. According to the data, the greatest share of Mound City, MO properties falls in the '$150,000 to $174,999' range, which is lower than the most significant median property across the country.
Property Taxes
One of the most important aspects for property owners is the amount of property taxes. This graph shows distribution of property taxes in Mound City, MO compared to median property taxes around the country. The prevalent amount of property taxes in Mound City, MO equals $1150, which is less than the national average.