Nags Head, NC 27959, USA apartments for sale
$509,000
$509,000
Available: Right Now
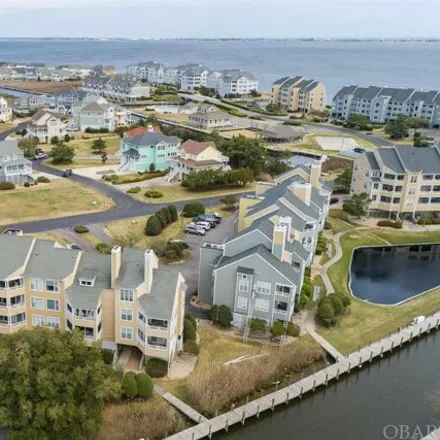
Canalfront, Covered Reserved Parking! Welcome to Buccaneer Village, located within Pirate's Cove Resort in Manteo, NC. This Condo features 2 bedrooms, 2 baths and has been completelyUPDATEDsince 2019. This unit is Sold furnished,...
$599,950
$599,950
Available: Right Now
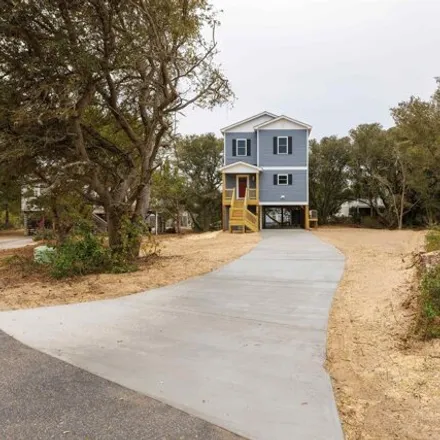
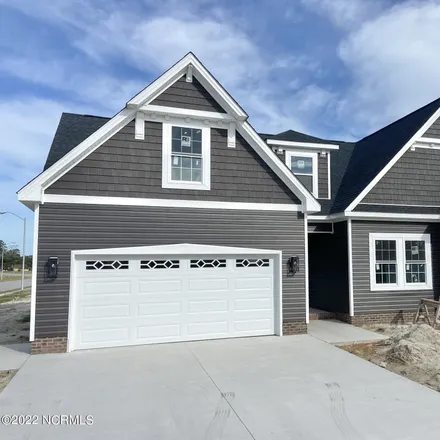
New Construction! Brand new wonderful home located in Old Nags Head Cove, one of the most popular year 'round neighborhoods on the Outer Banks. This low maintenance home has 3 bedrooms, 2 full baths, 1 partial bath, vinyl siding, wood floors on the f...
$1,65M
$1,65M
Available: Right Now
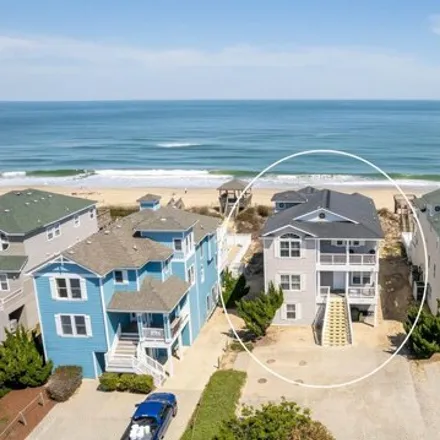
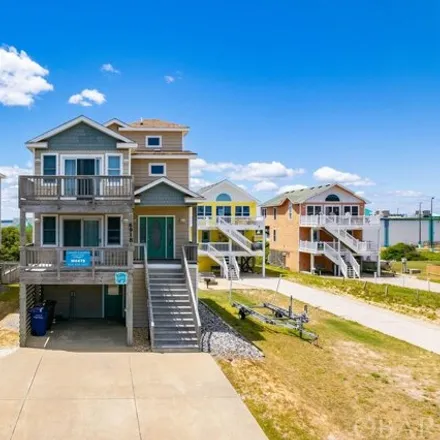
This stunning semi-oceanfront residence boasts an expansive layout, featuring eight bedrooms and seven and a half bathrooms. Its prime location in the heart of the Village of Nags Head provides convenient access to VNH private beach access and two So...
$3,28M
$3,28M
Available: Right Now
An investor ' S dream...incredible opportunity to own a 10 bedroom oceanfront in the heart of nags head w/ over 10% GRR in 2023! Almost every room in this home features a stunning Ocean View, and the top level primary suite has its own ...
$945,000
$945,000
Available: Right Now
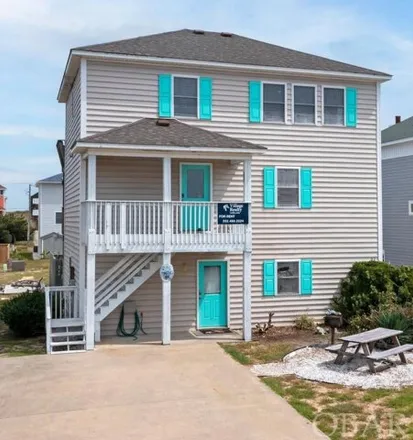
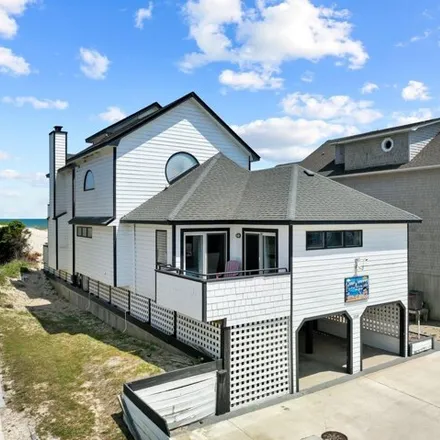
Enjoy ocean and sound views from this centrally located home. The close by deeded ocean access guarantees the beach is easily accessible and the property is just a short distance to restaurants, entertainment and shopping. The covered decks are perfe...
$940,000
$940,000
Available: Right Now
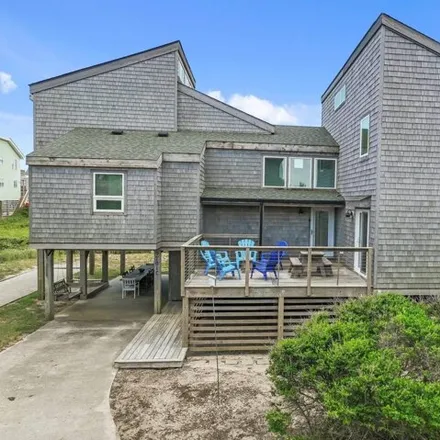
Think outside of the (beach) box! Just steps to the beach, check out this 4 bedroom, 3 bath contemporary home in South Nags Head. The split level design aids in privacy and reduction in noise. This unique beach house features two en suite bedrooms, 2...
$575,000
$575,000
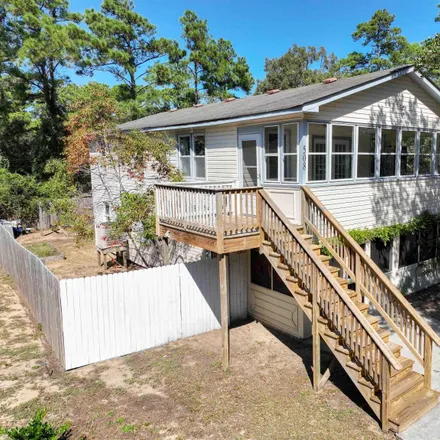
Available: Right Now
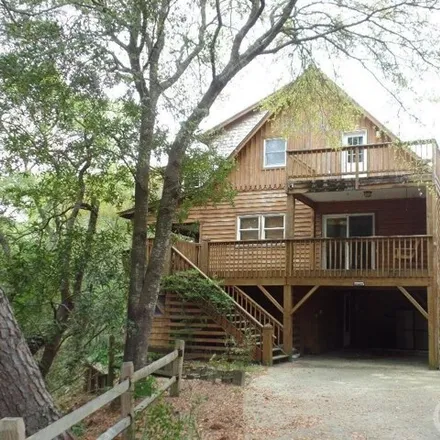
This rustic retreat is filled with charm and detail throughout. The remodeled kitchen has granite counter tops and stainless steel appliances. There are beamed ceilings, oak and pine flooring throughout, large private decks overlook the nature conser...
$749,000
$749,000
Available: Right Now
$1,08M
$1,08M
Available: Right Now
Location !!!Centrally located and very well maintained vacation home with proven rentals. Hosting up almost 2500 square feet of quality vacation living with tasteful decor throughout making more memory making moments. You will be welcomed with...
$799,000
$799,000
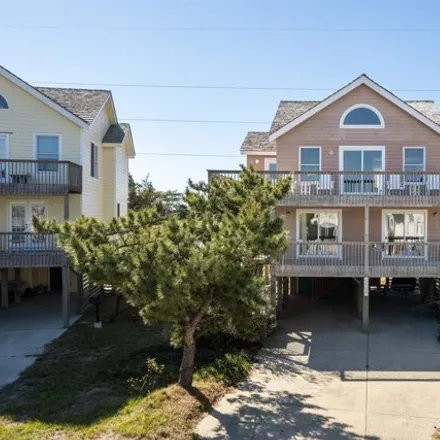
Available: Right Now
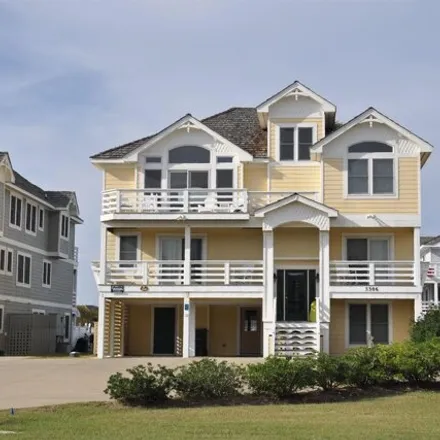
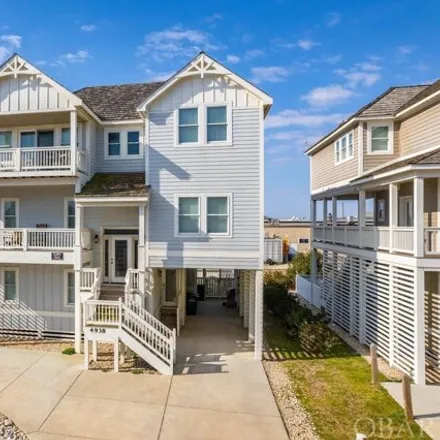
Nestled in the Village of Nags Head, this investment property or second home offers location value and close proximity to the beach, the Village Beach Club, Nags Head Golf Links and area attractions/shopping. Designed with an open floorplan, this4BR,...
$1,3M
$1,3M
Available: Right Now
Welcome to your coastal paradise! Nestled on a corner lot where E. Mall Dr. meets the Beach Road in the charming Village of Nags Head, this semi-oceanfront gem boasts everything you desire in beachfront living. Step inside this magnificent 7-bedroom,...
$455,000
$455,000
Available: Right Now

$365,000
$365,000
Available: Right Now
Check out this fully furnished one-bedroom condo, conveniently located near most of the amenities in Pirate's Cove. Ready for immediate occupancy, all you need is your swimsuit to enjoy the summer in our two pools or keep fit at the on-site fitness c...
$382,900
$382,900
Available: Right Now
$699,900
$699,900
Available: Right Now
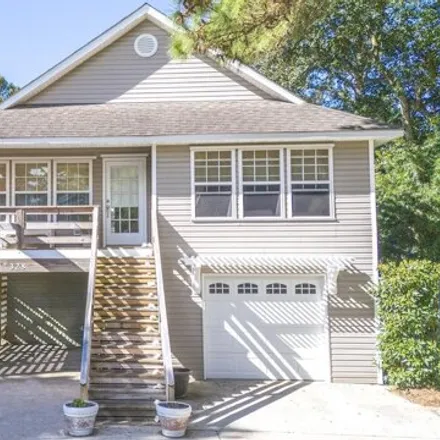
This home truly has everything you need to enjoy your life on the Outer Banks. This high elevated Coastal Cottage is located on the same ridge line as Jockeys Ridge Sate Park which is approximately a hundred yards away. In addition to that the home b...

$2,06M
$2,06M
Available: Right Now
$100K already booked for 2024! Instant Cash Flow at closing! Estimated $200K for2024 GRI.Get paid NOW for future bookings! If you are looking for a well maintained Nags Head Ocean Front, look no further! Trying to find a high returning, low maintenan...
$1,48M
$1,48M
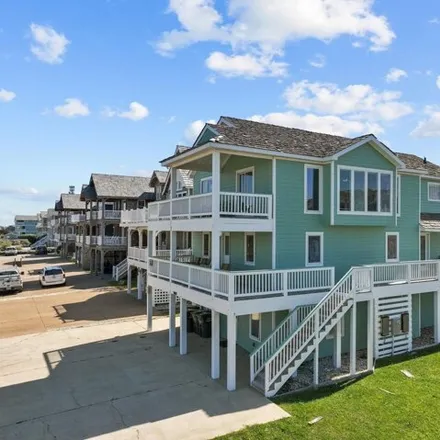
Available: Right Now
If you are looking for an upscale vacation rental investment property, Sailfish Station will have you hooked. This is a 6 bedroom, 6.5 bath home located in the Moongate community of Village at Nags Head. With over 3400 square feet, this quality built...
$849,900
$849,900
Available: Right Now
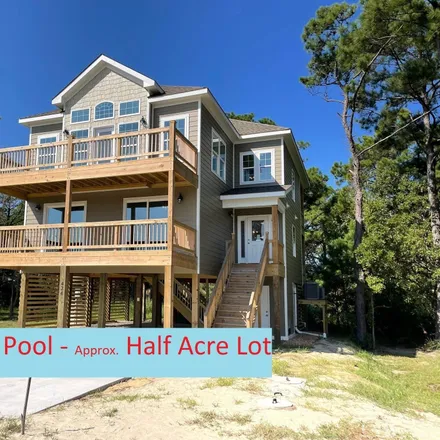
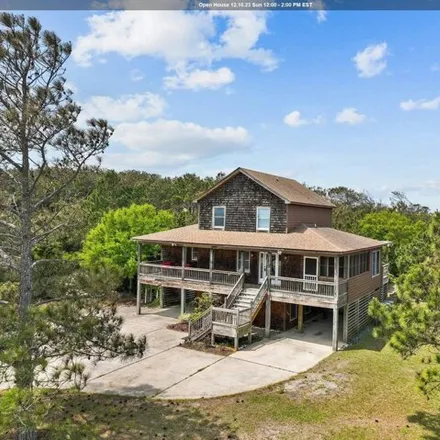
Almost half acre lot, X zone, no flood insurance required, private location, guest house! Main house has 4-bedrooms, 2.5-baths, perfect for hosting friends and family. The main floor boasts an open floor plan that effortlessly connects the living roo...

$4,1M
$4,1M
Available: Right Now
This investment property brings great returns year after year. The stunningly beautiful oceanfront home boasts 12 bedrooms and 12.5 bathrooms with a grand top-floor living area that reveals the beach and ocean views from every angle. The large window...

$899,000
$899,000
Available: Right Now
Unobstructed Ocean Views! You can't beat these views! Hear the waves, see the waves, smell the ocean! You can see whales and dolphins from your living room! Wake up to the Atlantic Ocean! Gaze over the high protective dune and see what's happening on...
$1,8M
$1,8M
Available: Right Now
With an incredible $225K remodel done this offseason, get ready to be wowed by this oceanfront stunner. Showing as one of the best in one of the most desirable locations on our beach not far from the legendary Millionaires row of Nags Head. With six ...
$2,9M
$2,9M
Available: Right Now
Rare South Nags Head opportunity! Owner-operated and meticulously maintained, this multiple-dwelling listing offers a remarkable location, 15 bedrooms across 5 units, ocean views and access and the ability to enjoy the charm of South Nags Head while ...
Nags Head
According to statistics, the population in Nags Head, NC amounts to 2,855, which shows decline 0% compared to the previous year. The median age of the city’s residents is 44. The average household income is $56,875, shifting decline 0% from the past year, and the average property value in Nags Head, NC decline -7% to $319,300 throughout the year.
Household Income
The average household income in Nags Head, NC grew from $56,707 to $56,875 in the past year. This data is an estimate based upon 1,288 households in Nags Head, NC . The chart below presents how household income is distributed in Nags Head, NC in comparison to the revenue allocation amid households nationally.
Property Value
According to data from last year, the average property value in Nags Head, NC shifted from $341,800 to $319,300 throughout the year. The subsequent graph indicates the share of properties in the given price range in Nags Head, NC in comparison to the median property value in the same price segment across the country. According to the data, the greatest share of Nags Head, NC properties falls in the '$300,000 to $399,999' range, which is higher than the most significant median property across the country.
Property Taxes
One of the most important aspects for property owners is the amount of property taxes. This graph shows distribution of property taxes in Nags Head, NC compared to median property taxes around the country. The prevalent amount of property taxes in Nags Head, NC equals $2500, which is less than the national average.