Nevada, IA 50201, USA apartments for sale

$265,000
$265,000
Available: Right Now
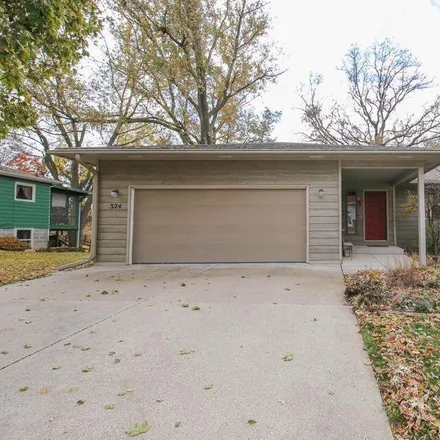
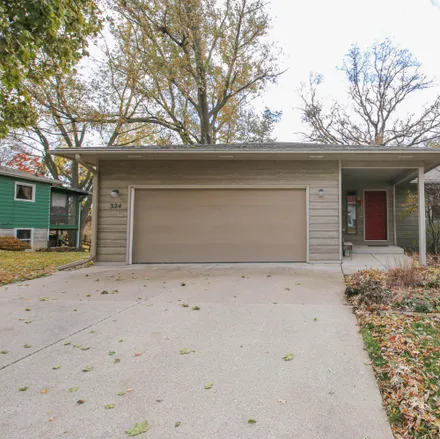
Welcome to 1840 10th St a 3-bedroom, 2.5-bathroom home offering an impressive amount of space. The first floor features a large primary bedroom with half bath ensuite and attached office. Two additional bedrooms, a large full bath, and a galley style...
$205,000
$205,000
Available: Right Now

$175,000
$175,000
Available: Right Now
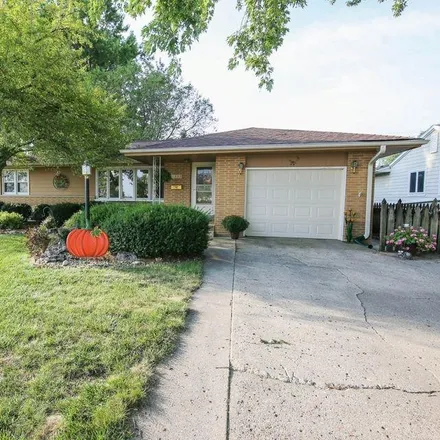
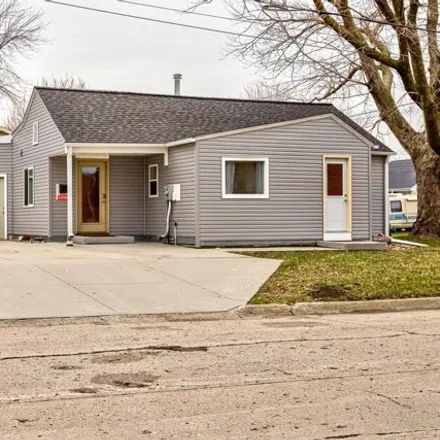
This cozy 2 bedroom, 1 bathroom home sits on a corner lot across from Hattery Park in the heart of the Nevada School District. Features include new carpet and LVP flooring, stainless steel appliances, and matte black fixtures and finishes throughout ...

$205,000
$205,000
Available: Right Now
$229,000
$229,000
Available: Right Now
$249,900
$249,900
Available: Right Now
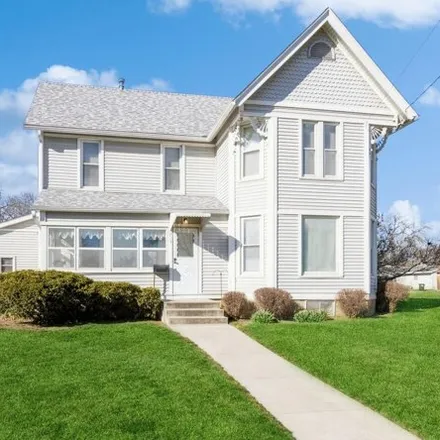
Dating back to 1880, this well cared for home boasts architectural character and thoughtful updates that define its character, telling a story of craftsmanship and tradition. Spread across two levels, the home offers ample space for comfortable livin...

$179,900
$179,900
Available: Right Now
Are you looking for a little more room to spread out and enjoy? Take a look at this 4 bedroom, 2 bathroom home in Nevada. Step on into this home and on the main level you will find the living room, dining room, spacious kitchen, den/office, rec room,...
$272,500
$272,500
Available: Right Now
$150,000
$150,000
Available: Right Now
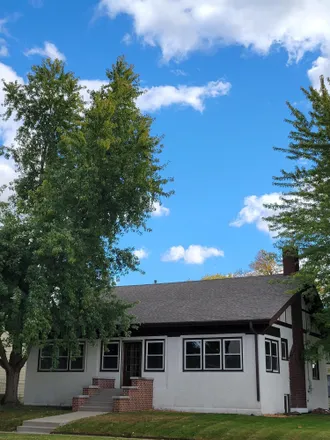
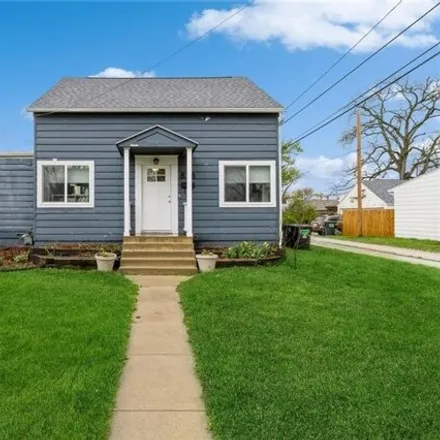
Welcome to this cozy starter home located on the NE side of Nevada. You will love the hardwood floors full of character, natural light filling every room, heated tile floors in the main floor full bath, all new windows/siding in December 2023, update...
$230,000
$230,000
Available: Right Now
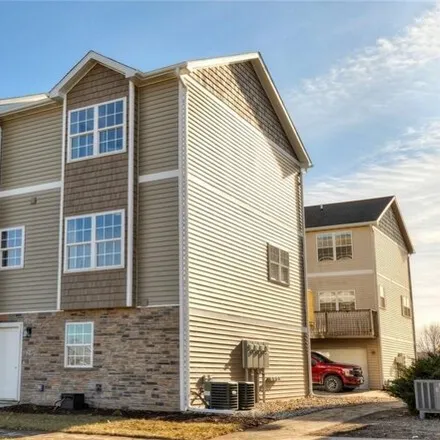
Check out this Affordable three story townhome in Nevada. The main level has an open concept layout, including a spacious kitchen with stainless steel appliances, informal dining area, living room, 1/2 bathroom and balcony. Upstairs you?ll fin...
$210,000
$210,000
Available: Right Now
You aren't going to want to miss this 3 bedroom, 3 bathroom home in the heart of Nevada. This home is situated just a couple blocks from Central Elementary, making this a great location. This 1.5 story home features 2 bedrooms on the main level, incl...

$78,000
$78,000
Available: Right Now
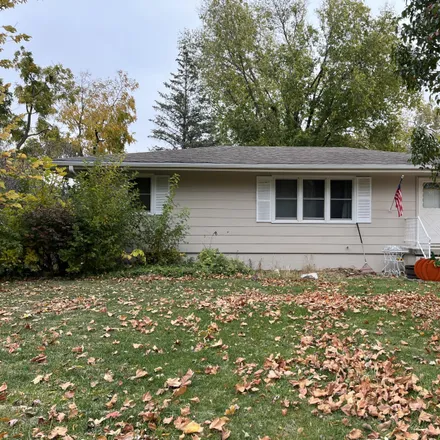
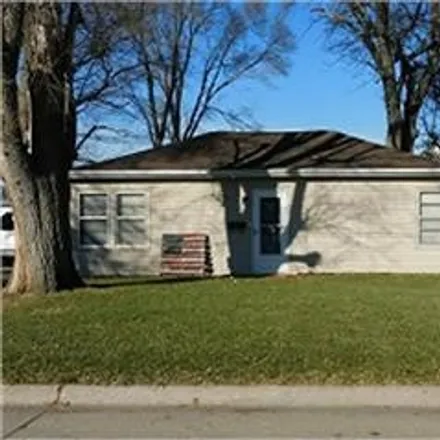
Ranch-style home on corner lot. Brick patio, 2 living spaces. One-story living with lots of potential. Property was built prior to 1978 lead based paint potentially exists. HUD home. FHA case # Sold ''AS-IS'' by electronic bid only. For property cond...
$200,000
$200,000
Available: Right Now
$315,000
$315,000
Available: Right Now
$315,000
$315,000
Available: Right Now
$229,000
$229,000
Available: Right Now
$240,000
$240,000
Available: Right Now
$210,000
$210,000
Available: Right Now
Apartment for sale in/on/near 625 15Th Street Place, Nevada. The price for this apartment is $210,000. This 1184-square-feet 3 bedroom apartment features 2 bathroom. Contact the agent to schedule an open house....

$385,500
$385,500
Available: Right Now
$130,000
$130,000
Available: Right Now

$225,000
$225,000
Available: Right Now
Gorgeous modern 3 bed townhome!!! Brand new upper level LVP flooring!!! Located just off of Lincoln Way, Easy access to Ames less than 10 minutes!!! The upper level features a large open floor plan living space with an electric fireplace, Cove...

$235,000
$235,000
Available: Right Now
Updates galore in this 3 bedroom, 1 car garage ranch home with a surprise kitchen/eating area and bonus porch in the back. Updates include: Bathroom, total kitchen remodel including all appliances, countertops and cupboards, gutters and gutter helmet...

$225,000
$225,000
Available: Right Now
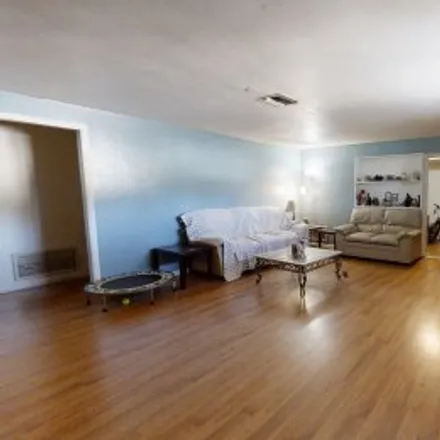
Welcome to your new home in the heart of Nevada! This home features 2 bedrooms, 2 bathrooms, and spreads out over1, 344sq. feet. As you step inside, you'll be greeted by the warmth of the new floor coverings installed in 2022, creating a cozy and inv...

$163,500
$163,500
Available: Right Now
Super Duper starter home! Large lot, fenced in area for a dog and a large deck for people. Two bedrooms, full bath, eat-in kitchen and living room with entry to the deck. Lower level family room with gas insert fireplace. Property taxes per Story Cou...

$150,000
$150,000
Available: Right Now
Welcome to this cozy starter home located on the NE side of Nevada. You will love the hardwood floors full of character, natural light filling every room, heated tile floors in the main floor full bath, all new windows/siding in December 2023, update...

$140,000
$140,000
Available: Right Now
Updates galore! Check out this 3-bedroom home with cottage-style in Nevada. Updates include a new roof with added ventilation, new electric panel, new Lennox HVAC, and much more! Seller installed brand-new carpet and kitchen flooring on April 1. Grea...

$285,000
$285,000
Available: Right Now
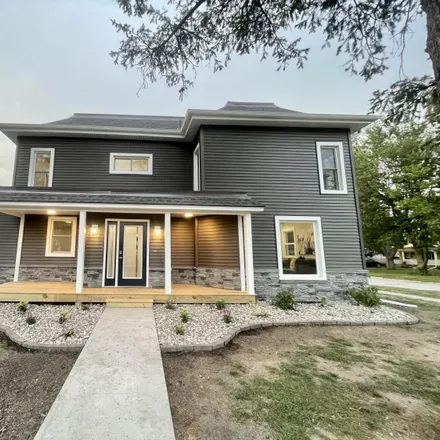
You aren't going to want to miss this home nestled in Nevada. This home offers the perfect blend of space, style, and serenity. Featuring 4 bedrooms and 2 bathrooms, it's the epitome of family living with a touch of luxury. As you step inside, you're...

$229,900
$229,900
Available: Right Now
Check out this well-maintained, clean duplex for sale! This location is fast and convenient, it's just two blocks north of Old Lincoln Highway. It's an easy commute to work for offices located outside of Nevada. The unit on the right side is currentl...
$235,000
$235,000
Available: Right Now
Check out this Affordable three story townhome in Nevada. The main level has an open concept layout, including a spacious kitchen with stainless steel appliances, informal dining area, living room, 1/2 bathroom and balcony. Upstairs you?ll fin...

$138,500
$138,500
Available: Right Now
This home is currently listed as ''delayed showing.'' Under no circumstances will any showings be allowed until2/27/2024at 9 AM. The sellers will not accept any proposed purchase agreements/offers earlier than9:00 PMon the first showing date.Adorable...
Nevada
According to statistics, the population in Nevada, IA amounts to 6,790, which shows decline 0% compared to the previous year. The median age of the city’s residents is 36. The average household income is $58,237, shifting growth 3% from the past year, and the average property value in Nevada, IA growth 4% to $128,300 throughout the year.
Household Income
The average household income in Nevada, IA grew from $56,672 to $58,237 in the past year. This data is an estimate based upon 2,775 households in Nevada, IA . The chart below presents how household income is distributed in Nevada, IA in comparison to the revenue allocation amid households nationally.
Property Value
According to data from last year, the average property value in Nevada, IA shifted from $123,400 to $128,300 throughout the year. The subsequent graph indicates the share of properties in the given price range in Nevada, IA in comparison to the median property value in the same price segment across the country. According to the data, the greatest share of Nevada, IA properties falls in the '$100,000 to $124,999' range, which is lower than the most significant median property across the country.
Property Taxes
One of the most important aspects for property owners is the amount of property taxes. This graph shows distribution of property taxes in Nevada, IA compared to median property taxes around the country. The prevalent amount of property taxes in Nevada, IA equals $2500, which is less than the national average.