Newburg, ND 58762, USA apartments for sale
$89,000
$89,000
Available: Right Now
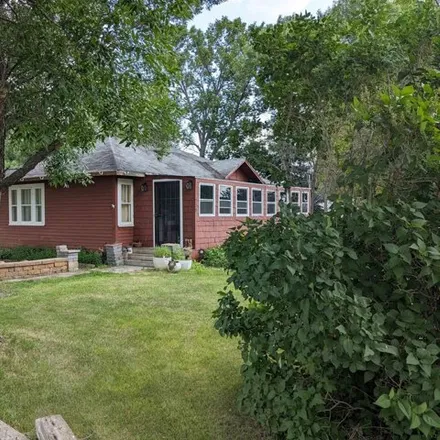
Situated on four lots in the serene town of Newburn, this property offers a unique opportunity with it's abundance of garden space and mature trees that includes pines, apple trees, grapes, cherries, plums, and raspberries. Enjoy the pleasures of gar...
Newburg
According to statistics, the population in Newburg, ND amounts to 124, which shows decline -16% compared to the previous year. The median age of the city’s residents is 48. The average household income is $78,333, shifting decline 0% from the past year, and the average property value in Newburg, ND decline -3% to $101,700 throughout the year.
Household Income
The average household income in Newburg, ND declined from $78,393 to $78,333 in the past year. This data is an estimate based upon 60 households in Newburg, ND . The chart below presents how household income is distributed in Newburg, ND in comparison to the revenue allocation amid households nationally.
Property Value
According to data from last year, the average property value in Newburg, ND shifted from $105,100 to $101,700 throughout the year. The subsequent graph indicates the share of properties in the given price range in Newburg, ND in comparison to the median property value in the same price segment across the country. According to the data, the greatest share of Newburg, ND properties falls in the '$100,000 to $124,999' range, which is lower than the most significant median property across the country.
Property Taxes
One of the most important aspects for property owners is the amount of property taxes. This graph shows distribution of property taxes in Newburg, ND compared to median property taxes around the country. The prevalent amount of property taxes in Newburg, ND equals $800, which is less than the national average.