Nicholasville, KY 40356, USA apartments for sale

$410,000
$410,000
Available: Right Now
This home could be the ONE! You will not want to miss this beautifully upgraded home especially since it may have just what you have been looking for. When you come inside you will feel right at home with the upgrades that the sellers have done after...
$490,000
$490,000
Available: Right Now
A spacious, beautiful, corner lot home, in the sought after Heritage Estates neighborhood. Sits comfortably in in West Jessamine School District minutes from many schools, Nicholasville Rd, Wilmore, Harrodsburg Rd, Lexington, downtown Nicholasville e...
$287,500
$287,500
Available: Right Now
Carefree living at it's finest! This is literally a perfect find if you want something ready to move into and do nothing. Seller had a gorgeous new kitchen installed with new cabinets, granite countertops, stainless appliances, and new first floor fl...

$520,000
$520,000
Available: Right Now
Convenience, worry free living in this all brick Blackaby model, 3 Bedroom and 3 Bath patio home in desirable Brannon Gardens. This impeccable home offers many upgrades and amenities throughout including wood floors, tile and carpet, built-in book sh...

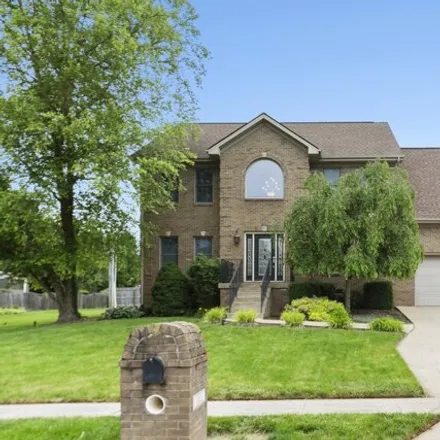
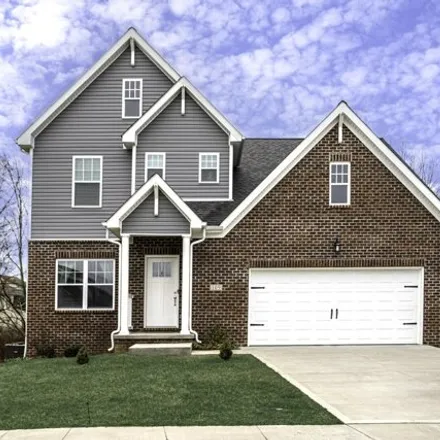
$409,900
$409,900
Available: Right Now
This stunning and spacious Ranch Style home on a fully finished basement, is back on the market! (due to no fault of the sellers)Don't miss this turn-key home, perfectly located in a quiet, well-Established neighborhood, near shopping and restaurants...

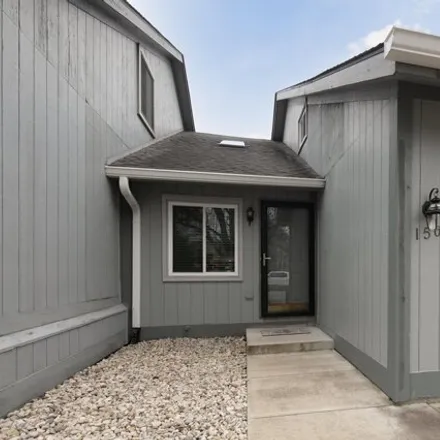
$195,900
$195,900
Available: Right Now
Don't miss out on this beautiful spacious townhome offering 3 bedroom and 2.5 bath with convenient parking and just minutes from downtown Nicholasville. This split level townhome offers 3 spacious bedrooms and 2 bathrooms upstairs with large closets ...
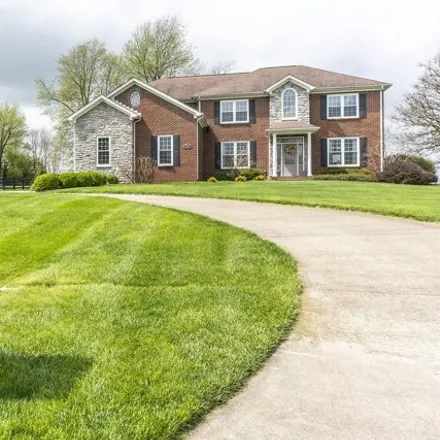
$725,000
$725,000
Available: Right Now
Immaculately maintained one owner home in Hickman Creek Pointe, backing to farmland and next to a permanent green space! This home offers five bedrooms, three full baths and over 3200sqft, on a level, one acre lot. Enter in to the two-story foyer and...
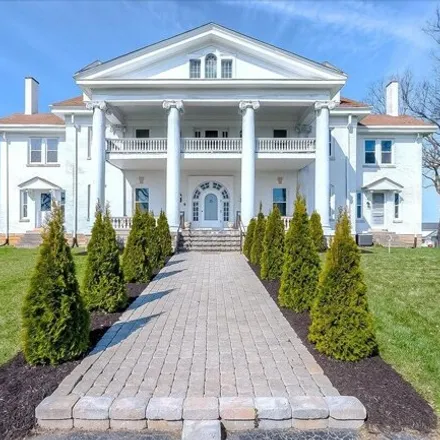
$995,000
$995,000
Available: Right Now
Beautiful updated historic property sitting on 2.75 acres in the heart of downtown Nicholasville with endless opportunities! Zoned B-1, this property can be a residence, a business or a combination of both. The sellers have painstakingly updated the ...
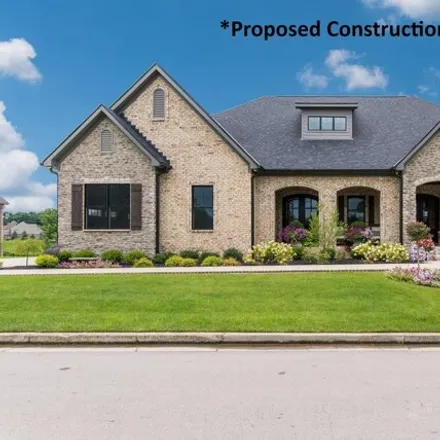
$1,35M
$1,35M
Available: Right Now
Proposed construction Having a hard time finding a new home?? Look no further than ''The Donato'' by Southern Luxury Homes! This sizable ranch boasts over3, 300s.f. to go along with a full unfinished basement. The first floor offers a gorgeous entryw...

$319,900
$319,900
Available: Right Now
Welcome to 112 Bridgeside Drive. This 3 bedroom, 2 bath home is located in Southern Nicholasville and is move in ready. The main level consists of a good size bedroom, full bath, updated kitchen with sought after gas range, formal dining room, and la...
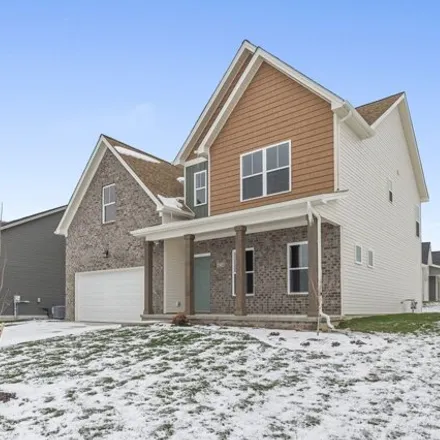
$415,900
$415,900
Available: Right Now
Expires february 10 !!! 4.99% Interest Rate for the first year, 5.99% Interest Fixed Interest Rate for the remaining years on a 30-year mortgage! Contracts must be written between today and February10, 2024! Move-in ready New Constructi...
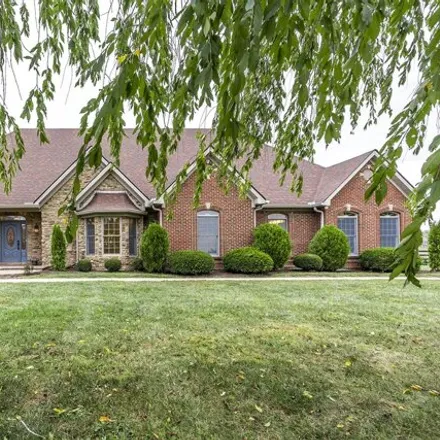
$1,04M
$1,04M
Available: Right Now
Open house Sunday 28th, 1-3 PM. ABeautiful Sprawling All Brick Home In North Jessamine County on 5 Acres Awaits Its New Owner. A stylish renovation has taken place to provide an expanded floor plan of 5 bedrooms, 4 full baths, 2, 1/2bath. It i...
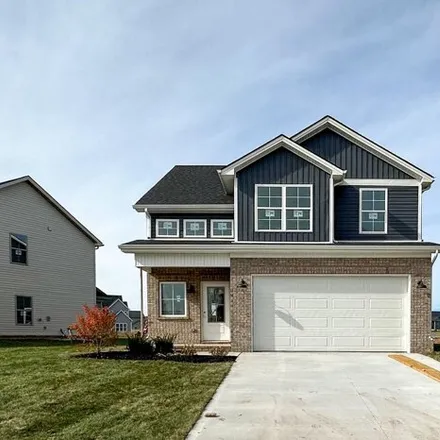
$365,000
$365,000
Available: Right Now
Almost complete! Very close to Burley Ridge. Check out this lot! Enter through 2 story foyer with natural sunlight and LVP stair case. LVP throughout first floor. Gorgeous kitchen with Waypoint Cabinets and will feature granite counter tops, white su...
$447,000
$447,000
Available: Right Now
Welcome Home! This move-in-ready James Monroe home was built in 2021. It introduced the ''Grace'' plan to the Eastgate Subdivision. This versatile plan features 3 bedrooms, 2.5 bathrooms, granite, a 4-foot family room extension and an unfinished base...

$387,900
$387,900
Available: Right Now
Ready to move in Newly Constructed! Stunning all one level Ranch plan located in Burley Ridge Development, minutes off US27 Bypass and the new Connector Road. Covered front porch with great attention to detail, double door front entrance creates a gr...
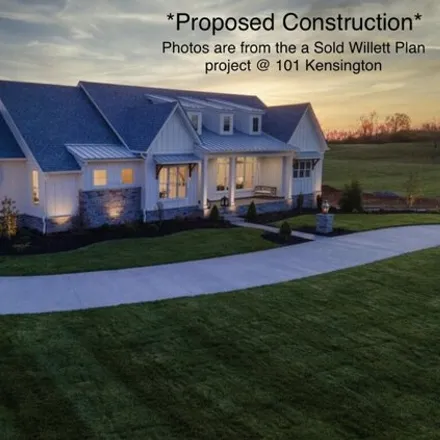
$1,39M
$1,39M
Available: Right Now
Central KY's Newest and Finest Community - Kensington is now serving this Proposed construction of The Willett on the Rocks. This Mitch Canup Homes Custom built Stone w/ Board and Batten Hardiplank Ranch on a Finished Side Walk Out Basement. The exte...
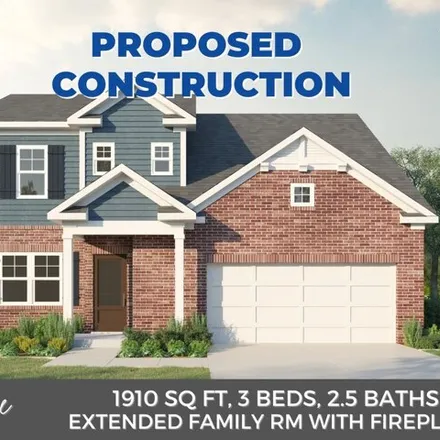
$352,800
$352,800
Available: Right Now
Proposed construction by James Monroe Homes. The Grace plan offers homeowners the perfect balance of living area on the first floor and bedrooms on the second floor. The exterior features the choice of a Farmhouse, French Country, or Cottage f...

$402,400
$402,400
Available: Right Now
Newly built one level home, move in ready in Burley Ridge Subdivision! Custom built 3 bedrooms, 2 bath with 2 car garage. Large open vaulted great room with luxury vinyl plank flooring that opens to beaufitul kitchen that includes painted cabinetry, ...
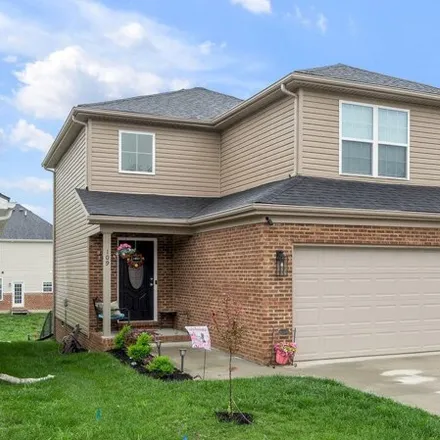
$299,000
$299,000
Available: Right Now
Here is your chance to own this spacious like new home offering three bedrooms, two and a half baths in the heart of Nichlosville. Conveniant to everything you would need including Brannon Crossing and Lexington. The kitchen offers white cabinetry, i...

$425,000
$425,000
Available: Right Now
Welcome to this spacious 3386 sq. ft. home featuring 5 bedrms and 3.5 baths offering endless possibilities for comfortable living, with additional rear parking for lower-level entrance, high ceilings throughout, ample storage and a smoke-free environ...

$449,900
$449,900
Available: Right Now
Charm abounds in this beautiful home located in the sought after neighborhood of Heritage Estates.This bright and airy home is bathed in natural light, showcasing gleaming hardwood floors that run throughout the open-concept main level. Perfect for e...

$215,000
$215,000
Available: Right Now
Nestled in the heart of Nicholasville, KY, this charming brick home boasts 3 cozy bedrooms and a great updated bathroom perfect for first-time home buyers, retirees, or savvy investors. Situated on 0.19 acres with 1067 finished square feet of living ...
Nicholasville
According to statistics, the population in Nicholasville, KY amounts to 29,547, which shows growth 1% compared to the previous year. The median age of the city’s residents is 36. The average household income is $47,669, shifting growth 6% from the past year, and the average property value in Nicholasville, KY growth 1% to $139,700 throughout the year.
What is the Average Price of Apartments for Sale in Nicholasville, KY, 40356?
| Month | Median Price |
|---|---|
| Jun 2024 |
$320,499
|
| May 2024 |
$307,993
|
| Apr 2024 |
$304,318
|
| Mar 2024 |
$304,318
|
| Feb 2024 |
$304,318
|
| Jan 2024 |
$304,318
|
| Month | Median Price |
|---|---|
| Jun 2024 |
$342,932
|
| May 2024 |
$349,234
|
| Apr 2024 |
$361,469
|
| Mar 2024 |
$361,469
|
| Feb 2024 |
$361,469
|
| Jan 2024 |
$361,469
|
Household Income
The average household income in Nicholasville, KY grew from $45,169 to $47,669 in the past year. This data is an estimate based upon 11,070 households in Nicholasville, KY . The chart below presents how household income is distributed in Nicholasville, KY in comparison to the revenue allocation amid households nationally.
Property Value
According to data from last year, the average property value in Nicholasville, KY shifted from $137,700 to $139,700 throughout the year. The subsequent graph indicates the share of properties in the given price range in Nicholasville, KY in comparison to the median property value in the same price segment across the country. According to the data, the greatest share of Nicholasville, KY properties falls in the '$150,000 to $174,999' range, which is lower than the most significant median property across the country.
Property Taxes
One of the most important aspects for property owners is the amount of property taxes. This graph shows distribution of property taxes in Nicholasville, KY compared to median property taxes around the country. The prevalent amount of property taxes in Nicholasville, KY equals $1150, which is less than the national average.