Oakland, MD 21550, USA apartments for sale
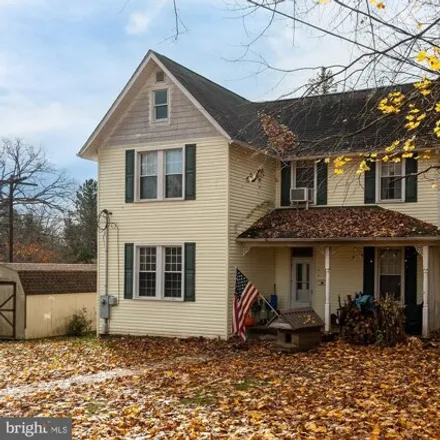
$175,000
$175,000
Available: Right Now
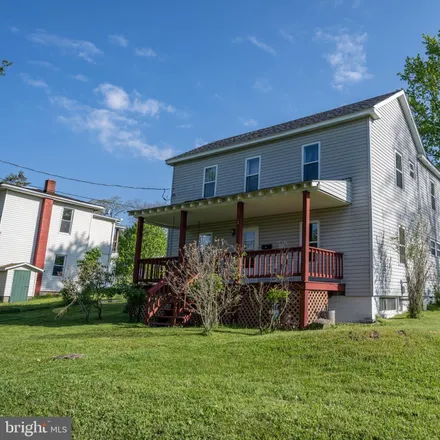
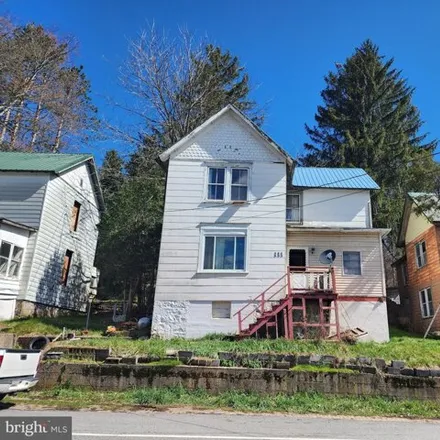
In the heart of the quaint town of Oakland sits this 2-story historic home on a level lot with four bedrooms, two bathrooms and hardwood floors. Several upgrades over the years new furnace in 2022 and new siding in 2012. The possibilities are endless...
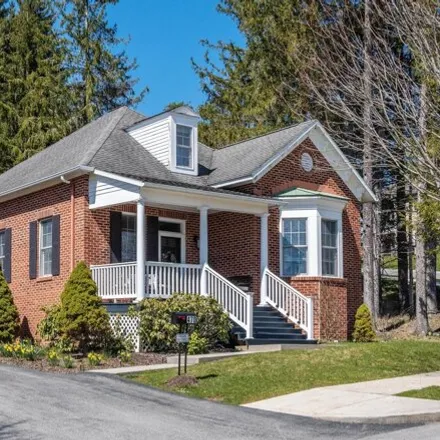
$339,000
$339,000
Available: Right Now
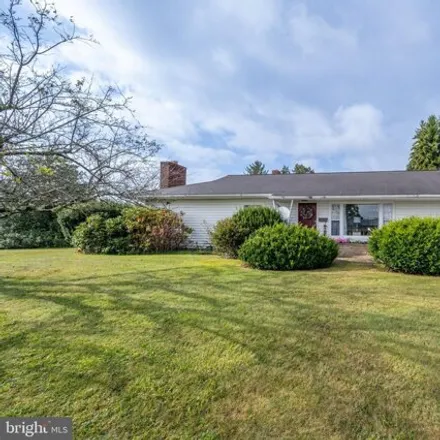
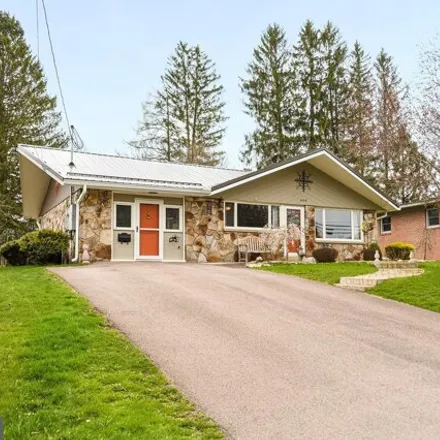
4BR, 2BAmodern brick rancher. Built in 2006, this home offers elite one-level living, efficient heating + central AC and has several handicap accessible features. Fantastic curb appeal, paved driveway and attached 2 car garage, all on a.24 acre lot. ...
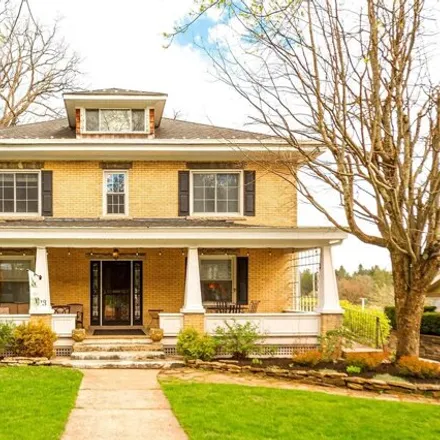
$429,900
$429,900
Available: Right Now
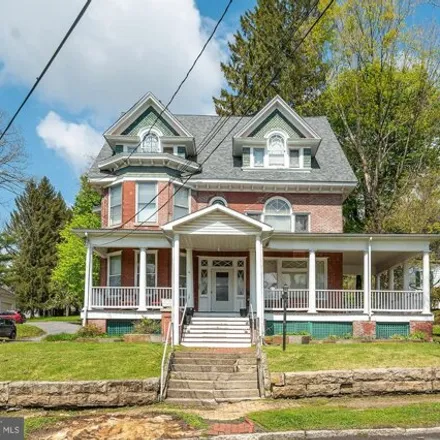
Discover the epitome of Victorian elegance on coveted 2nd Street in Oakland! This stunning home has been masterfully renovated from top to bottom, boasting modern amenities while preserving its timeless charm. From the upgraded electrical and plumbin...
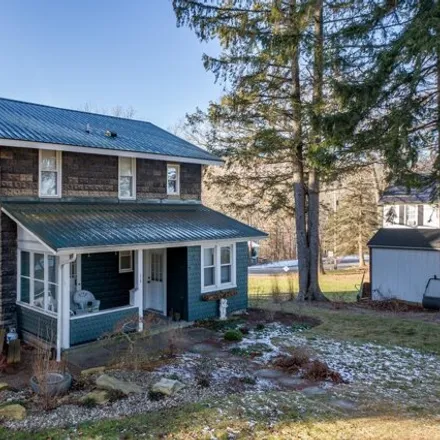
$219,000
$219,000
Available: Right Now
The best of both worlds! Soak in the original charm of this home near downtown Oakland that has updates and remodeling over the years! Featuring an updated kitchen with stainless steel appliances, a metal roof with gutters, vinyl windows, and an ener...
$234,000
$234,000
Available: Right Now
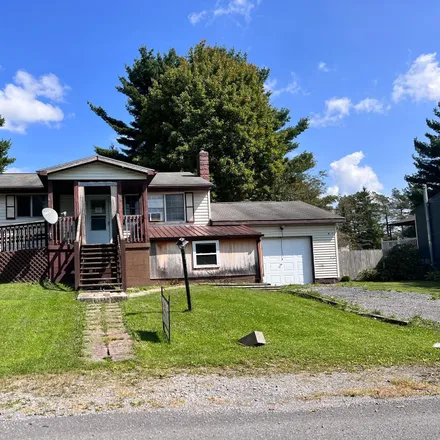
Dont miss the opportunity for home ownership in Southern Garrett County. Welcome to your single level 3-bedroom ranch-style home. This charming property offers a host of inviting features like built-ins, hardwood floors and a level spacious yard. The...
$279,000
$279,000
Available: Right Now
$85,500
$85,500
Available: Right Now
$89,900
$89,900
Available: Right Now
$259,000
$259,000
Available: Right Now
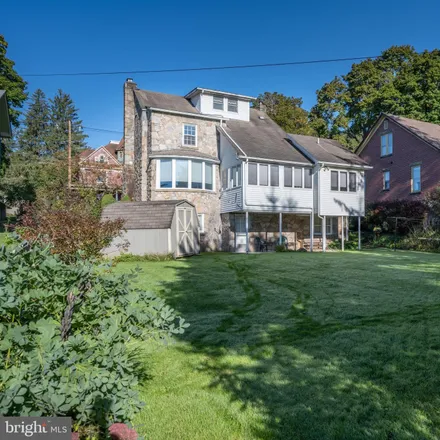
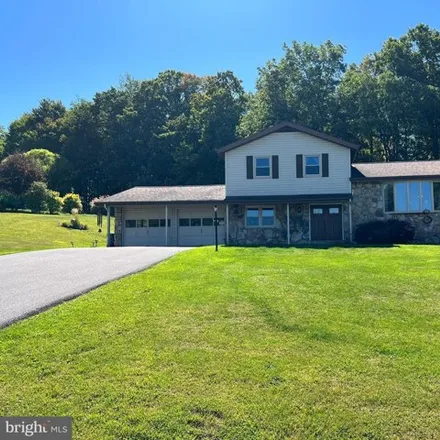
Indulge in the charm of this exquisite single-level 3-bedroom, 2-bathroom home nestled on a picturesque lot less than 1 mile from downtown Oakland. With its appealing stone exterior and immaculately maintained interior, this residence offers effortle...
$499,000
$499,000
Available: Right Now
Check out this one of a kind property! Located on 2nd street, lined with cobble stone walkways and mature Oak trees, in the historic and beautiful town of Oakland Maryland. This meticulously maintained and cared for Colonial style zoned apartment bui...
$345,000
$345,000
Available: Right Now
Seize the opportunity for town living with this expansive 3/4 bedroom abode. Boasting versatile rooms perfect for office conversion, this home has undergone updates including contemporary bathrooms, fresh flooring, and upgraded appliances. Dual welco...
$10,000
$10,000
Available: Right Now
Online auction: Bidding begins4/12/2024@10:00 AM.Bidding ends4/16/2024@10:50 AM.List Price is Suggested Opening Bid. Deposit: $5, 000.Detached home located in the Oakland, MD area of Garrett County . just minutes to the Garrett Regional...
Oakland
According to statistics, the population in Oakland, MD amounts to 1,744, which shows decline -13% compared to the previous year. The median age of the city’s residents is 53. The average household income is $32,600, shifting decline -1% from the past year, and the average property value in Oakland, MD decline -7% to $163,600 throughout the year.
What is the Average Price of Apartments for Sale in Oakland, MD, 21550?
| Month | Median Price |
|---|---|
| Apr 2024 |
$678,003
|
| Mar 2024 |
$632,289
|
| Feb 2024 |
$632,289
|
| Jan 2024 |
$632,289
|
| Dec 2023 |
$598,609
|
| Nov 2023 |
$187,362
|
| Month | Median Price |
|---|---|
| Apr 2024 |
$849,122
|
| Mar 2024 |
$886,887
|
| Feb 2024 |
$886,887
|
| Jan 2024 |
$886,887
|
| Dec 2023 |
$839,322
|
| Nov 2023 |
$367,547
|
Household Income
The average household income in Oakland, MD declined from $32,917 to $32,600 in the past year. This data is an estimate based upon 820 households in Oakland, MD . The chart below presents how household income is distributed in Oakland, MD in comparison to the revenue allocation amid households nationally.
Property Value
According to data from last year, the average property value in Oakland, MD shifted from $176,500 to $163,600 throughout the year. The subsequent graph indicates the share of properties in the given price range in Oakland, MD in comparison to the median property value in the same price segment across the country. According to the data, the greatest share of Oakland, MD properties falls in the '$175,000 to $199,999' range, which is lower than the most significant median property across the country.
Property Taxes
One of the most important aspects for property owners is the amount of property taxes. This graph shows distribution of property taxes in Oakland, MD compared to median property taxes around the country. The prevalent amount of property taxes in Oakland, MD equals $1150, which is less than the national average.