Oakwood, TX 75855, USA apartments for sale
$165,000
$165,000
Available: Right Now
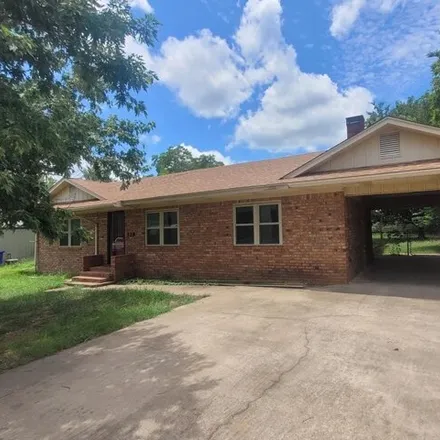
Adorable 3 bedroom 2 bath brick home conveniently located within walking distance to Oakwood ISD. Enter into this cozy family room with beautiful hardwood floors. Newly updated kitchen, Spacious bedrooms, sunroom, and Shiplap laundry. Outdoors enjoy ...

$15,000
$15,000
Available: Right Now
OakwoodTX - 0.26AC -This property is being sold ( AS IS ) There is an old home that has utilities available but home is not in livable condition....

$69,900
$69,900
Available: Right Now
Nice starter home or to downsize too. This3 BR 2BAhouse offers you a country living in Oakwood. The property is in decent shape ready for you to update and comes with just under a 1/2 acre tract of land. Come see what this property has to offer....
$199,900
$199,900
Available: Right Now
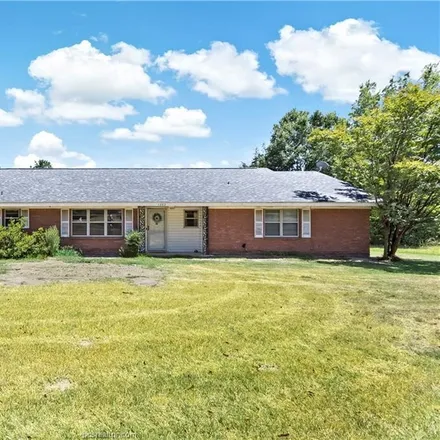
5 acres and a three bedroom, three bathroom ranch style home could be yours in oakwood, tx ! In the heart of Oakwood, TX sits a well thought out home with a livable floor plan with so much room for entertaining. Through the front door you are ...
Oakwood
According to statistics, the population in Oakwood, TX amounts to 565, which shows decline -1% compared to the previous year. The median age of the city’s residents is 40. The average household income is $40,729, shifting decline -6% from the past year, and the average property value in Oakwood, TX decline -29% to $53,300 throughout the year.
What is the Average Price of Apartments for Sale in Oakwood, TX, 75855?
| Month | Median Price |
|---|---|
| Jun 2024 |
$385,891
|
| May 2024 |
$334,796
|
| Apr 2024 |
$335,557
|
| Mar 2024 |
$335,557
|
| Feb 2024 |
$335,557
|
| Jan 2024 |
$335,557
|
| Month | Median Price |
|---|---|
| Jun 2024 |
$385,003
|
| May 2024 |
$382,694
|
| Apr 2024 |
$374,394
|
| Mar 2024 |
$374,394
|
| Feb 2024 |
$374,394
|
| Jan 2024 |
$374,394
|
Household Income
The average household income in Oakwood, TX declined from $43,333 to $40,729 in the past year. This data is an estimate based upon 155 households in Oakwood, TX . The chart below presents how household income is distributed in Oakwood, TX in comparison to the revenue allocation amid households nationally.
Property Value
According to data from last year, the average property value in Oakwood, TX shifted from $75,400 to $53,300 throughout the year. The subsequent graph indicates the share of properties in the given price range in Oakwood, TX in comparison to the median property value in the same price segment across the country. According to the data, the greatest share of Oakwood, TX properties falls in the '$50,000 to $59,999' range, which is lower than the most significant median property across the country.
Property Taxes
One of the most important aspects for property owners is the amount of property taxes. This graph shows distribution of property taxes in Oakwood, TX compared to median property taxes around the country. The prevalent amount of property taxes in Oakwood, TX equals $800, which is less than the national average.