Oblong, IL 62449, USA apartments for sale

$219,900
$219,900
Available: Right Now
This home is move in ready. The remodel includes all new flooring, lighting, trim and fresh paint. This owner also replaced all of the paneling with new drywall and fresh paint, giving this home a modern and brightened up look. Over2, 000sq.ft. inclu...
$215,000
$215,000
Available: Right Now
Step into a world of warmth and comfort as you enter this newly remodeled modern living space. This stylish house boasts sleek modern finishes and an abundance of natural light that beams through the generous and all new replacement windows. The kitc...
$199,000
$199,000
Available: Right Now
Welcome to this recently renovated 3-bedroom, 2-bathroom home nestled in the heart of town. Bright and airy, the open living area welcomes you with abundant natural light, seamlessly flowing into the dining space and newly revamped kitchen boasting s...

$399,000
$399,000
Available: Right Now
Welcome to your dream home! This brand-new, move-in-ready 3-bedroom, 2-bathroom house seamlessly blends modern design with functionality. Situated in an up-and-coming subdivision, this home is bathed in natural light and encompasses an open-concept l...

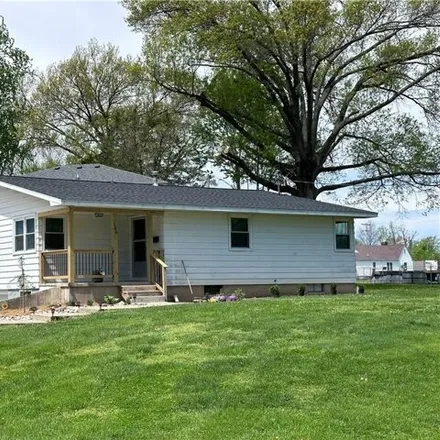
$127,500
$127,500
Available: Right Now
Partially furnished move-in ready home freshly landscaped with an attached garage. This home offers a front covered porch along with a large, fenced back yard with a shed. This would be a great starter home or for someone who wants to downsize!...

$42,500
$42,500
Available: Right Now
2 bedroom/1 bath home with detached garage. Great rental investment property or flip house. Being sold "AS IS"...
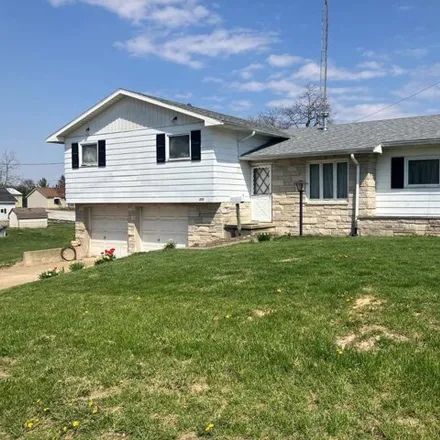
$86,000
$86,000
Available: Right Now
This split level home with attached 2 car garage needs some TLC. The sellers are the original owners. Bedrooms are located on the north end of the home on the upper level. The main level has a living room, dining room, kitchen, utility room and half ...

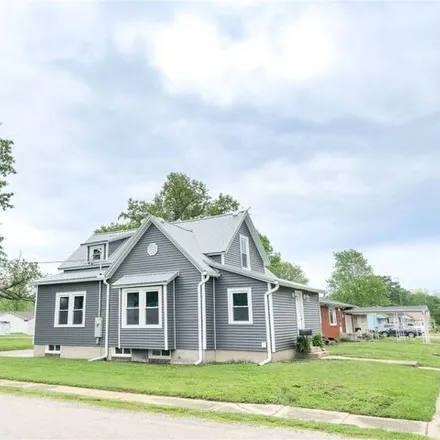
$168,000
$168,000
Available: Right Now
Remodeled 2-story home boasts old charm with modern updates including new LVP flooring throughout, some new lighting. 4 bedrooms and 2 full baths. There is a 1 car attached garage along with a detached 2 car garage with wall heater and covered carpor...

$38,900
$38,900
Available: Right Now
This 2 bedroom1 bath needs some TLC but is a great investment property or starter home. Kitchen has room for a dining room table. it also has a built in hutch. The detached garage is in the back of the property with access from Wilson St. Home is bei...
Oblong
According to statistics, the population in Oblong, IL amounts to 1,405, which shows decline -11% compared to the previous year. The median age of the city’s residents is 43. The average household income is $38,256, shifting growth 2% from the past year, and the average property value in Oblong, IL growth 2% to $62,400 throughout the year.
Household Income
The average household income in Oblong, IL grew from $37,330 to $38,256 in the past year. This data is an estimate based upon 646 households in Oblong, IL . The chart below presents how household income is distributed in Oblong, IL in comparison to the revenue allocation amid households nationally.
Property Value
According to data from last year, the average property value in Oblong, IL shifted from $61,300 to $62,400 throughout the year. The subsequent graph indicates the share of properties in the given price range in Oblong, IL in comparison to the median property value in the same price segment across the country. According to the data, the greatest share of Oblong, IL properties falls in the '$60,000 to $69,999' range, which is lower than the most significant median property across the country.
Property Taxes
One of the most important aspects for property owners is the amount of property taxes. This graph shows distribution of property taxes in Oblong, IL compared to median property taxes around the country. The prevalent amount of property taxes in Oblong, IL equals $800, which is less than the national average.