Olney, IL 62450, USA apartments for sale
$154,000
$154,000
Available: Right Now
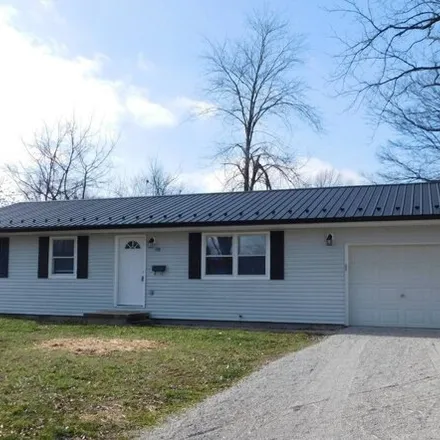
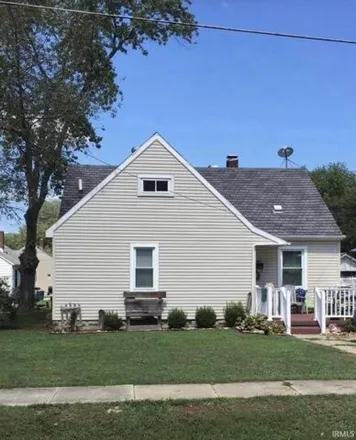
The owner has just completed a major remodel and it is NICE! New roof, central heat and air, hot water heater, brand new kitchen, 2 new bathrooms, all new flooring, ceiling lights and the list goes on!! The home has a spacious living room, kitchen is...
$379,900
$379,900
Available: Right Now
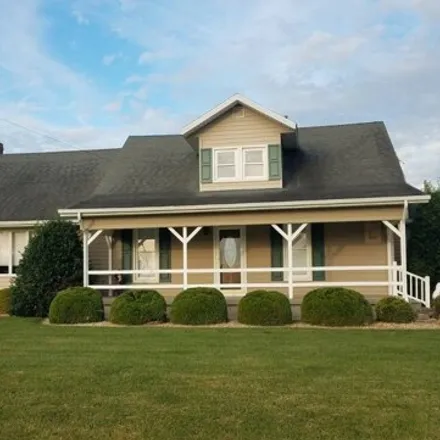
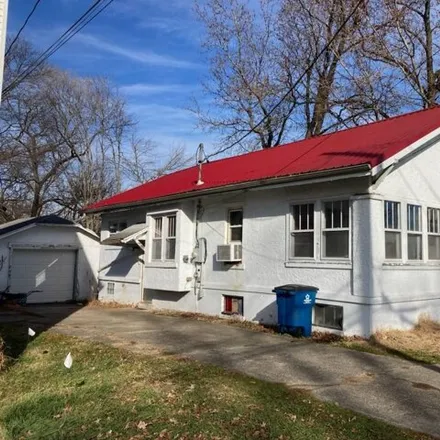
Located on Rt. 130 just north of Wal-Mart, the property is zoned C-2. The property consists of 13.46 acres with approximately 9 acres tillable. The home was originally built in 1926 but has had many updates and additions. Boasting 1900 square feet on...
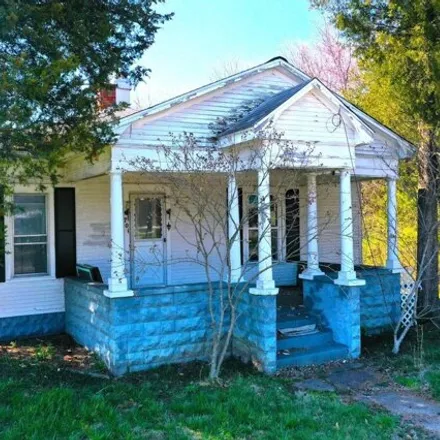
$119,000
$119,000
Available: Right Now
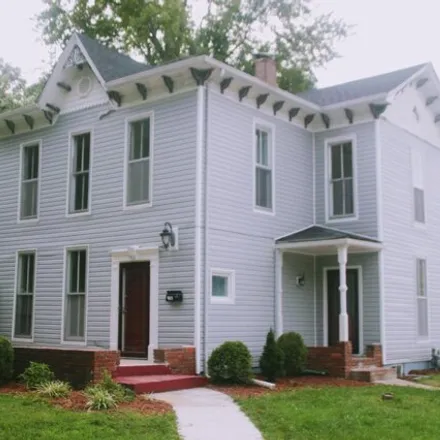
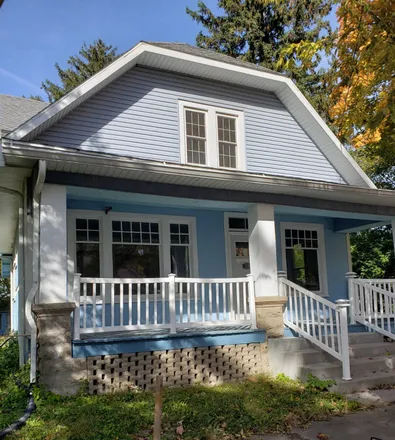
Stop the car. Beautiful traditional home in the heart of Olneys historic district. Step into the main level foyer and admire the detailed hardwood floors and traditional spindle staircase. The spacious living room allows plenty of natural light and o...
$3,9M
$3,9M
Available: Right Now
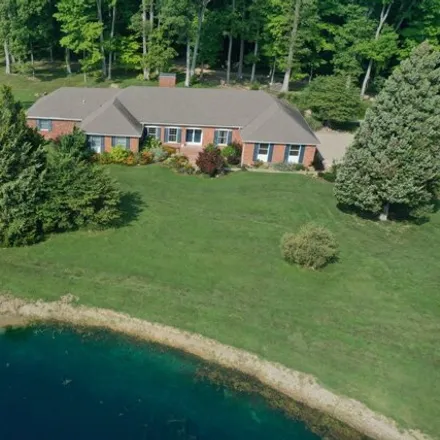
Contact Racklin Realty for additional details and to schedule your private viewing of this estate. Qualified buyers only. Experience the beauty of nature on this 133+/- acre estate located in Northern Richland County! As you enter this meticulously m...
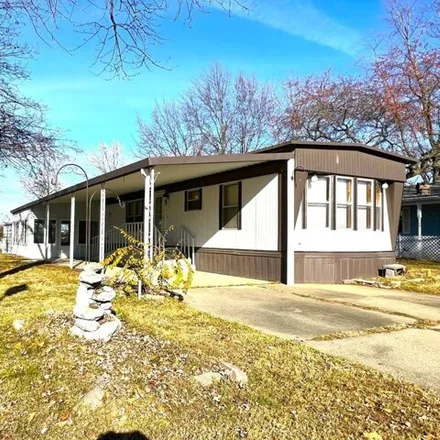
$24,900
$24,900
Available: Right Now
A cozy well maintained 2 bedroom, 2 1/2bath mobile home. It features an open concept living room, dining room and kitchen. The primary bedroom has en-suite bathroom with full size shower access. The 2nd bedroom has dual closets and built in dresser, ...
$59,000
$59,000
Available: Right Now
Step into the potential of this 3-bedroom, 2-bathroom home nestled in the heart of town. With a unique layout awaiting your personal touch, this residence offers an open-plan living space that's ready for a stylish transformation. The three bedrooms ...
$84,900
$84,900
Available: Right Now
Auction Listing. Great Opportunity to own this single-family home oozing with potential. This home was built in 1965 and features 4 bedrooms and 1.1 bathrooms, with plenty of living space . special notes : (1) This is a Cash only transa...
$109,900
$109,900
Available: Right Now
Offering 1495 square feet of living space, this single level home offers great space and ample storage inside in a great location near Musgrove Park. The interior of this home offers a living room, eat in kitchen, bonus room with storage, 3 bedrooms ...
$279,900
$279,900
Available: Right Now
Business opportunity with a home and updated garage on highly traveled Route 130 in Olney, IL. The 16.58 +/- acres of land features approximately 375ft of frontage, 3 curb cut outs with 2 being extra wide. The driveway area has been graded and additi...
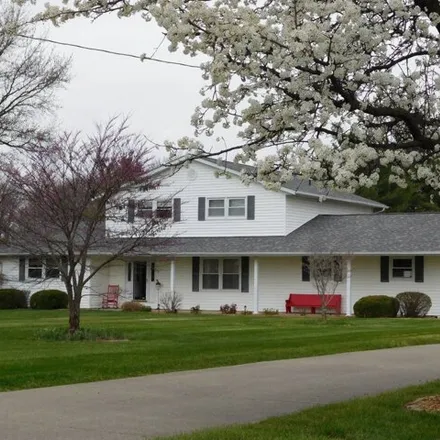
$429,900
$429,900
Available: Right Now
There is so much to love about this well maintained property that is conveniently located near schools. Situated up a long driveway on 3.10 acres this 1.5 story traditional home has gorgeous landscaping, inground pool with fence around it, hot tub, p...
$109,000
$109,000
Available: Right Now
$90,900
$90,900
Available: Right Now
$149,900
$149,900
Available: Right Now
$61,800
$61,800
Available: Right Now
$65,000
$65,000
Available: Right Now
$150,000
$150,000
Available: Right Now
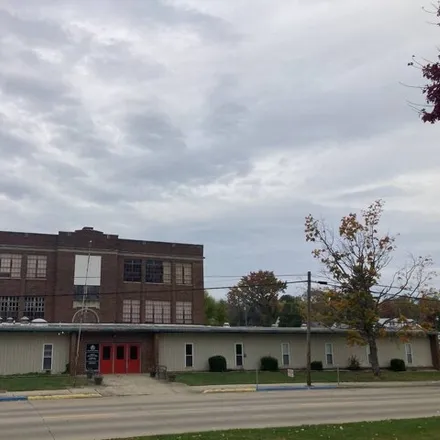
Streets on 4 sides of lot. Masonary Exterior, offices, rest rooms, much storage....
$74,900
$74,900
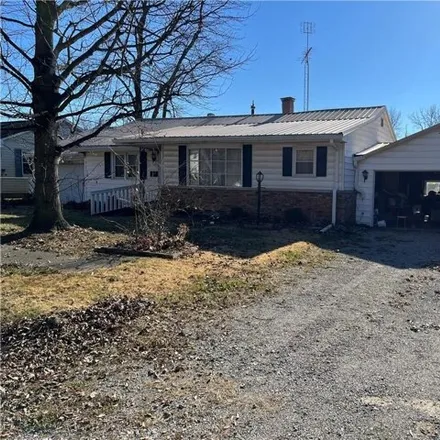
Available: Right Now
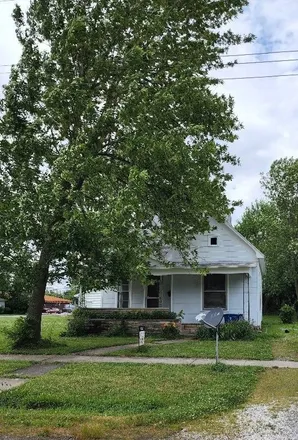
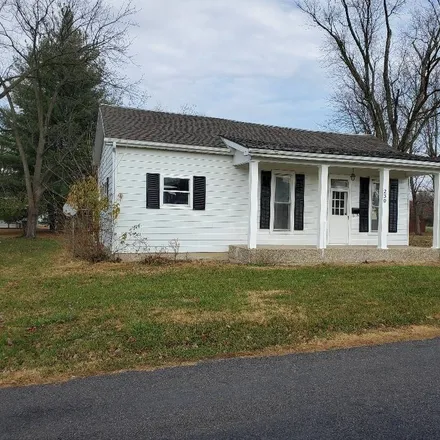
This charming home is ready for its new owners! Dont miss out on this opportunity. This 3 bedroom, 1 bath home features a spacious backyard, perfect for outdoor gatherings, gardening, or simply enjoying the fresh air. Schedule a viewing today!...
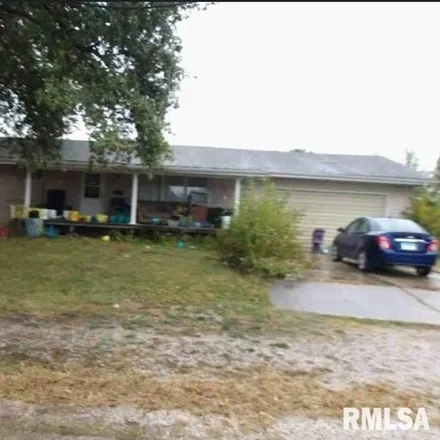
$70,000
$70,000
Available: Right Now
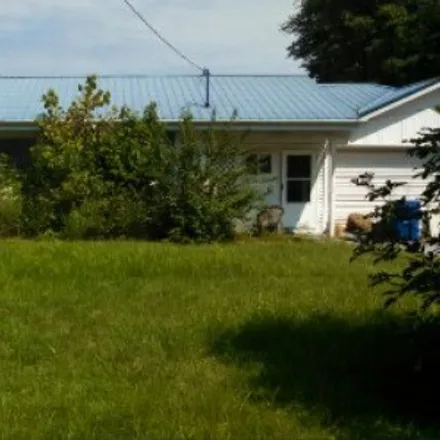
Full dryer basement with storm shleter room. Refrigerator and Gas range included with sale. Newer electric wiring, hot water on demand, newer roof and newer garage door with opener....
$62,700
$62,700
Available: Right Now
$59,000
$59,000
Available: Right Now
$57,400
$57,400
Available: Right Now
$65,000
$65,000
Available: Right Now
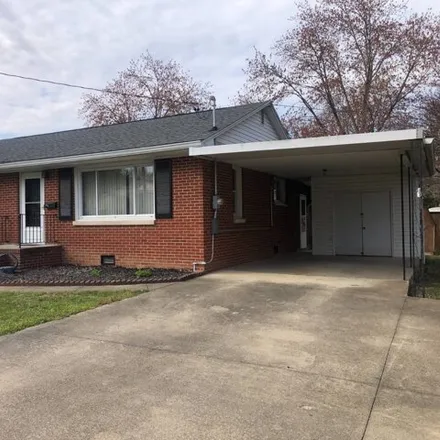
This home has had some updates completed in the last 5 years. Some new windows on the main level, new CHA, paint throughout, and new garage door! The main level of the home includes an inviting foyer, breakfast area, dining room, living room with gas...
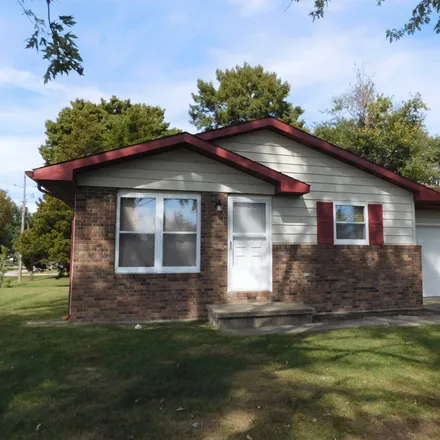
$139,000
$139,000
Available: Right Now
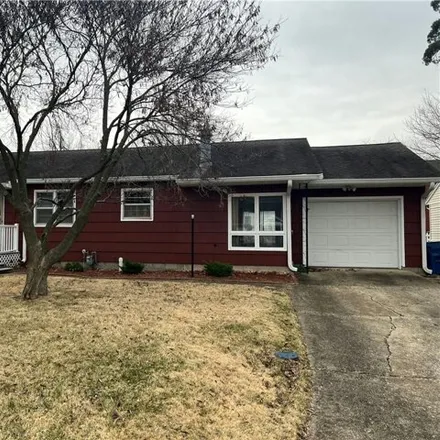
Fantastic 2 bedroom, 1 bathroom, 980 sq ft. Ranch style home with an attached single car garage. This well maintained home features a massive family room, good sized kitchen, sprawling back living room with gas fireplace, concrete patio out back and ...
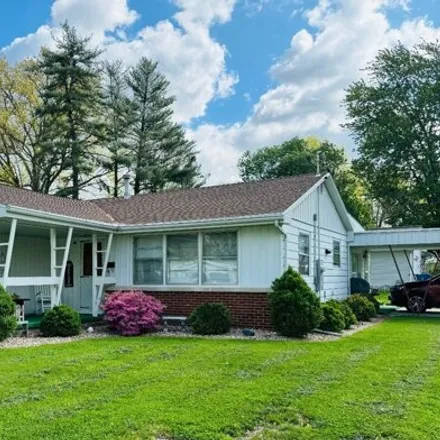
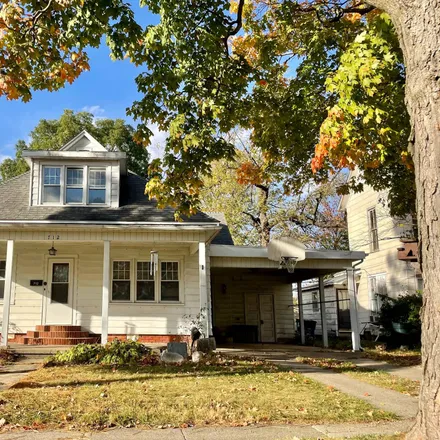
$104,900
$104,900
Available: Right Now
This charming property is located at 702 E Laurel St in Olney IL and is ready for a new owner. The home features 2 bedrooms, 1 bath, living room, eat-in kitchen, utility room and a large screened porch across the back of the house. Some updates inclu...
$69,000
$69,000
Available: Right Now
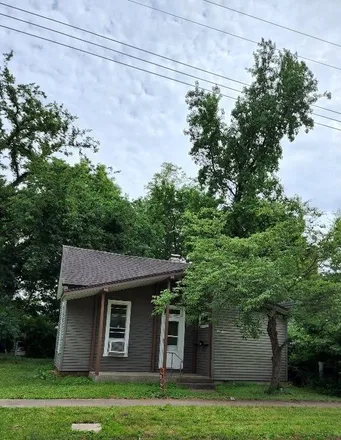
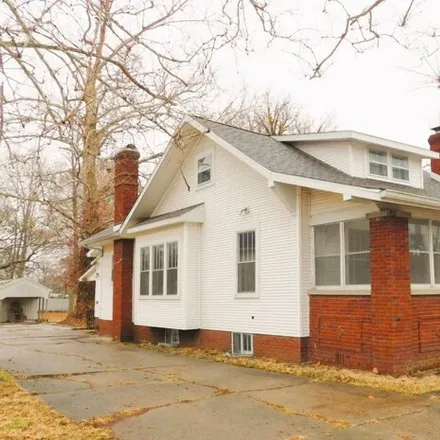
This home has had the major things remodeled in the last 3 years! New roof2021, HVAC 12/22,Hot water heater 11/23! There is still some work for the new Owner to complete. Inside the character of the craftsman style shines with extra built in cabinets...
$189,000
$189,000
Available: Right Now
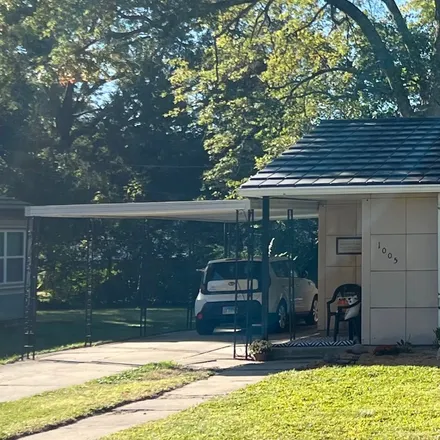
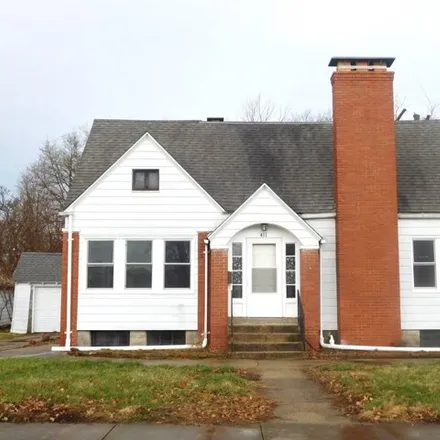
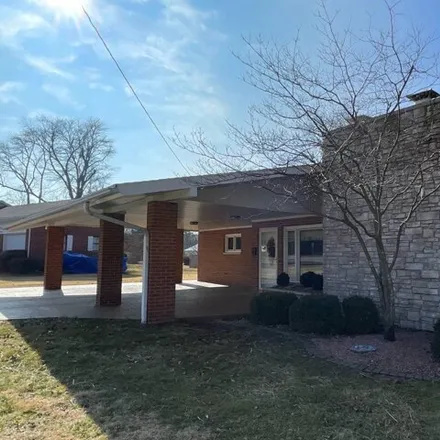
So much to love about this home with 3 bedrooms, 2 1/2baths, and over 2900 sq ft of living space! The immaculate brick exterior with beautiful stone chimney and a large, well designed, covered carport, greet you as you approach the house. Enter into ...
$49,900
$49,900
Available: Right Now
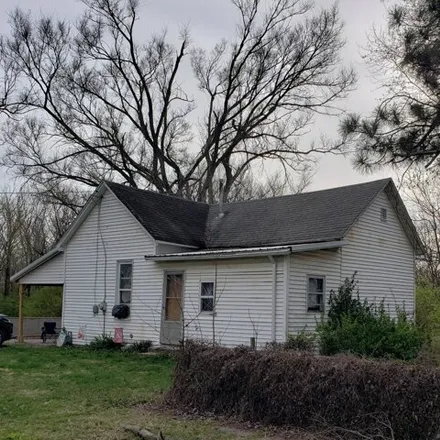
House with 3 bedrooms, one bathroom and single car carport. Home being sold "as is". Large Kitchen and laundry room. Income potential with a renter already renting for the past 5 years. Home on a double lot at the end of a Dead end Street. No applian...
Olney
According to statistics, the population in Olney, IL amounts to 8,910, which shows decline 0% compared to the previous year. The median age of the city’s residents is 41. The average household income is $37,278, shifting growth 1% from the past year, and the average property value in Olney, IL decline -1% to $82,200 throughout the year.
What is the Average Price of Apartments for Sale in Olney, IL, 62450?
| Month | Median Price |
|---|---|
| Apr 2024 |
$596,377
|
| Mar 2024 |
$596,377
|
| Feb 2024 |
$596,377
|
| Jan 2024 |
$596,377
|
| Dec 2023 |
$489,299
|
| Nov 2023 |
$441,735
|
Household Income
The average household income in Olney, IL grew from $36,743 to $37,278 in the past year. This data is an estimate based upon 3,798 households in Olney, IL . The chart below presents how household income is distributed in Olney, IL in comparison to the revenue allocation amid households nationally.
Property Value
According to data from last year, the average property value in Olney, IL shifted from $82,700 to $82,200 throughout the year. The subsequent graph indicates the share of properties in the given price range in Olney, IL in comparison to the median property value in the same price segment across the country. According to the data, the greatest share of Olney, IL properties falls in the '$100,000 to $124,999' range, which is lower than the most significant median property across the country.
Property Taxes
One of the most important aspects for property owners is the amount of property taxes. This graph shows distribution of property taxes in Olney, IL compared to median property taxes around the country. The prevalent amount of property taxes in Olney, IL equals $800, which is less than the national average.