Paint Rock, TX 76866, USA apartments for sale
$59,000
$59,000
Available: Right Now
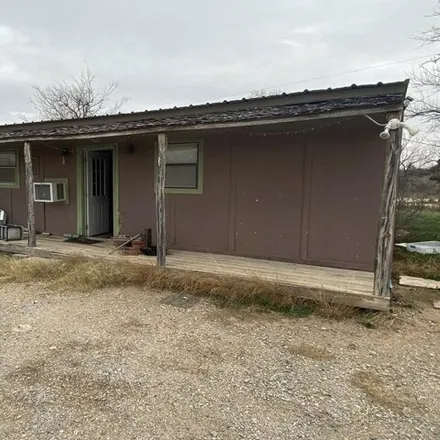
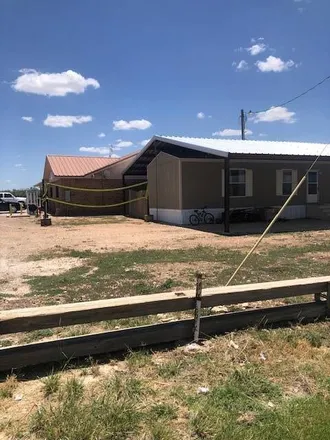
Price Improvement! Potential, potential, potential. Located just south of Paint Rock onUS HWY 83frontage with 2 lots, 2 living quarters and 10 RV parking sites. Both lots along with the 10 RV parking sites are fully equipped with water, electric and ...
$719,000
$719,000
Available: Right Now
An Outstanding location. Four Corners Truck Stop is Thriving and has a GREAT reputation. Gas, diesel, deli food, propane, deer corn, bait (12 miles from one of the Top 5 fishing lakes in texas ), groceries, ice, beer, wine, showe...
Paint Rock
According to statistics, the population in Paint Rock, TX amounts to 361, which shows decline -3% compared to the previous year. The median age of the city’s residents is 44. The average household income is $50,313, shifting growth 4% from the past year, and the average property value in Paint Rock, TX growth 3% to $75,000 throughout the year.
Household Income
The average household income in Paint Rock, TX grew from $48,500 to $50,313 in the past year. This data is an estimate based upon 67 households in Paint Rock, TX . The chart below presents how household income is distributed in Paint Rock, TX in comparison to the revenue allocation amid households nationally.
Property Value
According to data from last year, the average property value in Paint Rock, TX shifted from $72,500 to $75,000 throughout the year. The subsequent graph indicates the share of properties in the given price range in Paint Rock, TX in comparison to the median property value in the same price segment across the country. According to the data, the greatest share of Paint Rock, TX properties falls in the '$100,000 to $124,999' range, which is lower than the most significant median property across the country.
Property Taxes
One of the most important aspects for property owners is the amount of property taxes. This graph shows distribution of property taxes in Paint Rock, TX compared to median property taxes around the country. The prevalent amount of property taxes in Paint Rock, TX equals $800, which is less than the national average.