Rogersville, TN 37857, USA apartments for sale

$850,000
$850,000
Available: Right Now
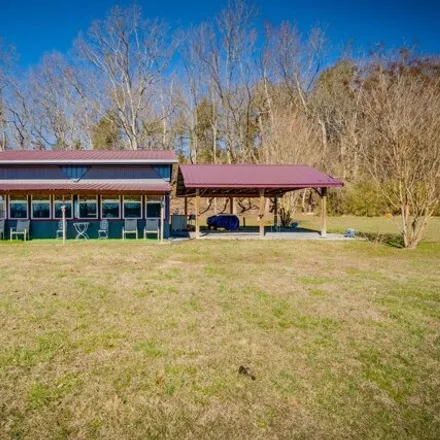
Standing stately on top of Cedar Knoll with magnificent views just minutes outside of Historic Rogersville. This 5 bedroom , 4 full bath home was custom built in 1973 by Virgil Carpenter and boast approx 4, 464+/- square ft on approx 4+/- all usable ...

$122,500
$122,500
Available: Right Now
Investment Property just outside Rogersville. Two rental properties one is cottage 1 bedroom and 1 bath new door and some new windows rents for $350 monthly Second home is single wide 3 bedroom 2 baths rents for 4475 monthly. this home has new water ...

$219,900
$219,900
Available: Right Now
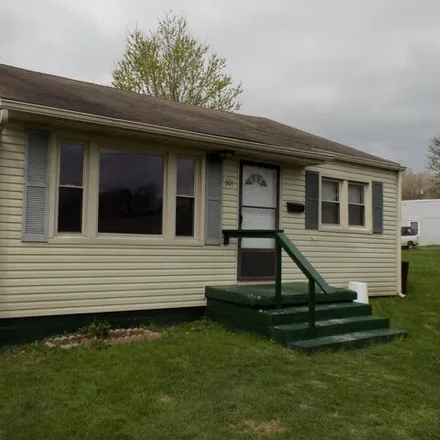
ChatGPT Explore this newly renovated 3-bedroom, 2-bathroom home for sale in Rogersville, TN. Situated conveniently close to restaurants, shopping centers, and employment opportunities, it offers modern comforts within a charming community setting. Id...

$244,900
$244,900
Available: Right Now
This 2 bed 2 bath townhouse offers a very convenient location, large master bed and bath, hardwood floors as well as an attached 1 car garage. This is an ideal one level living situation with little maintenance required. All appliances to convey incl...
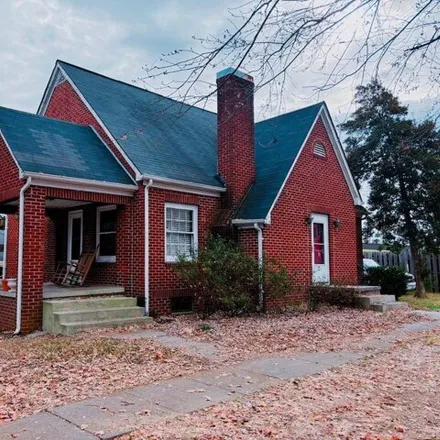
$339,000
$339,000
Available: Right Now
Motivated seller price adjustment. This 1.66-acre property features two distinct residences just outside the Rogersville city limits . no city taxes ! The three bedroom, two bath, main home is an A-Frame Brick with over2, 000square feet...

$183,500
$183,500
Available: Right Now
This property includes a 3 bedroom, 2 bath single wide on 2.08 acres. Lots of potential with this property. Located on Hwy 11, there's commercial potential. Open your business, use as a rental, or make it your home. All appliances convey, including w...

$219,900
$219,900
Available: Right Now
Take a look at this beautifully remodeled home, just minutes from Downtown Historic Rogersville. This 2 bedroom two bath home has beautiful brand new hardwood floors throughout. New cabinetry, new, appliances, and new light fixtures. Make your appoin...

$365,000
$365,000
Available: Right Now
Tri level up to 3 bedroom, with up to 4 bedrooms, 3 full bath home with approx total 2, 654+/ square ft. The Metal roof was updated@11 years ago, the ''Carrier'' HVAC was updated@15 years ago. This home has a brand new deck, heated finished basement ...

$219,900
$219,900
Available: Right Now
Discover this spacious 4-bedroom, 5-bathroom home, offering ample space and comfort for your family. With a total of 6 rooms, this property provides flexibility for your living needs. Situated in a convenient location on highway 11W, it features a we...

$269,900
$269,900
Available: Right Now
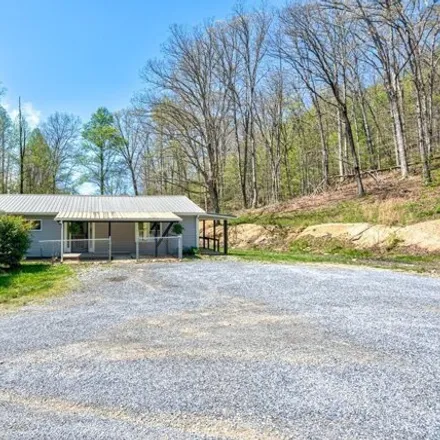
Check out this unrestricted 3 bed 2 bath raised ranch. A charming clean and custom-built home sitting atop a gentle hill with wooded views of mature trees and an extensive front yard. The backyard is private with a large screened in porch to enjoy pe...

$649,000
$649,000
Available: Right Now
Large brick ranch home built in 1967 located at the end of a dead end low traffic road. This huge brick ranch features 3 bedrooms 2 1/2 bathrooms. The roof is architectural shingle and is approx 5 yrs old, the home has dual HVAC systems for upstairs ...
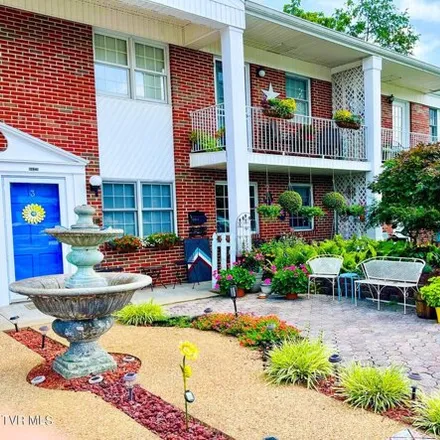
$199,900
$199,900
Available: Right Now
Discover the perfect blend of comfort and convenience in this 2 bedroom, 3 bathroom condo nestled in the heart of Rogersville at Colonial Villas. With almost 1600 square feet of living space, you'll find spacious bedrooms, including a master with its...
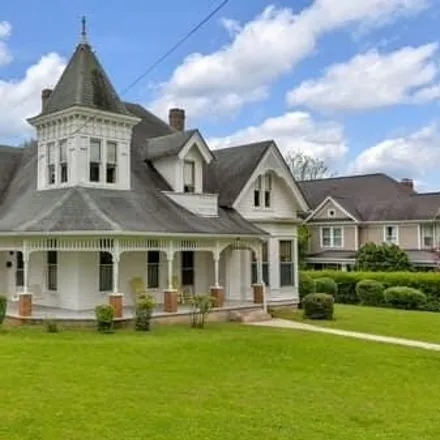
$699,900
$699,900
Available: Right Now
Take a step back into time into this absolutely gorgeous victorian home located in the heart of historic Rogersville. To say that it is a rare, one of a kind find is an understatement. It architecture is exquisite and still very solid although over a...
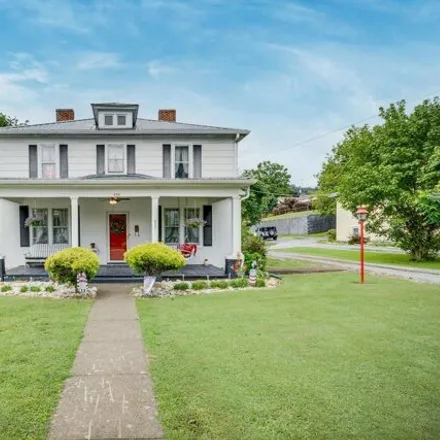
$395,000
$395,000
Available: Right Now
If you have been looking for a home with history and on Main Street Rogersville, then you have found the right house. This home was built in 1900 and is in the historic district. This 5 bedroom, 2 bath two-story is on a nice flat lot and has been wel...

$459,000
$459,000
Available: Right Now
Lovingly maintained, solidly built brick home in the most sought-after neighborhood of Rogersville, TN in West Hills. This beautiful custom built home was constructed by one of Rogersville's premier contractors, and has stood the test of time. This g...

$259,000
$259,000
Available: Right Now
Three bedroom, one and a half bath ranch in a quiet subdivision. Drive under the attached carport out of the weather and walk into the this 1 level home. This home was built in 1987 and has approx 1, 092+/- square ft. The home has public water, sewer...

$191,000
$191,000
Available: Right Now
Open house 6/1/2024 from 2-4 pm. This a beautifully well-maintained home featuring 2 bedrooms, 1 bathroom, approximately 1050 square feet. The kitchen features custom cabinets, stainless appliances, and a formal dining room. The laundry room i...

$189,000
$189,000
Available: Right Now
This property includes 2 single wides, approximately 840 sq ft on 1.05 acres. Located on Hwy 11w, there is an opportunity for commercial use as well. You could use it for a business, or keep it as rental income. There is city water and high speed int...
$129,900
$129,900
Available: Right Now
Nice two bedroom and one bath vinyl siding home with approximately 812 sq. ft. of living space and situated on a level lot. Other features include vinyl and hardwood flooring, shingle roof, central heat and air, insulated windows and the appliances s...
$224,900
$224,900
Available: Right Now
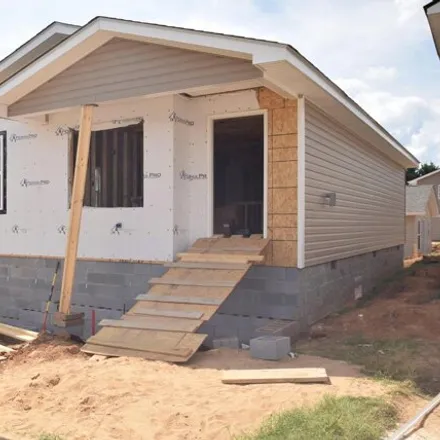
NEW 2023Construction, Corner Lot, in the Heart of Historical Rogersville, all main level living, 2 Bedrooms, 2 Full Baths, Walk-In Showers in both baths . no carpet, Great Retirement Home, Single Person or a Starter Home, Public Water and Publ...
$399,990
$399,990
Available: Right Now
This charming 1 bedroom, 1 bath, open floor plan located on the river is a must see home. You can enjoy the indoor covered patio with windows to sit and watch the sun come up over the river. Inside is all open floor plan with a small kitchenette and ...
$339,900
$339,900
Available: Right Now
As you drive up the driveway and it opens up, it's breathtaking to see this nicely done, newly remodeled 3 bedroom, 2 bath home on 0.89 acre. Peaceful and private this home is located in the Pressmens Home Community. Covered front porch, covered side...
Rogersville
According to statistics, the population in Rogersville, TN amounts to 4,326, which shows decline -1% compared to the previous year. The median age of the city’s residents is 43. The average household income is $32,353, shifting growth 20% from the past year, and the average property value in Rogersville, TN growth 4% to $121,300 throughout the year.
What is the Average Price of Apartments for Sale in Rogersville, TN, 37857?
| Month | Median Price |
|---|---|
| Jun 2024 |
$381,357
|
| May 2024 |
$284,546
|
| Apr 2024 |
$254,035
|
| Mar 2024 |
$254,035
|
| Feb 2024 |
$254,035
|
| Jan 2024 |
$254,035
|
| Month | Median Price |
|---|---|
| Jun 2024 |
$317,709
|
| May 2024 |
$305,722
|
| Apr 2024 |
$281,936
|
| Mar 2024 |
$281,936
|
| Feb 2024 |
$281,936
|
| Jan 2024 |
$281,936
|
Household Income
The average household income in Rogersville, TN grew from $26,869 to $32,353 in the past year. This data is an estimate based upon 1,804 households in Rogersville, TN . The chart below presents how household income is distributed in Rogersville, TN in comparison to the revenue allocation amid households nationally.
Property Value
According to data from last year, the average property value in Rogersville, TN shifted from $117,200 to $121,300 throughout the year. The subsequent graph indicates the share of properties in the given price range in Rogersville, TN in comparison to the median property value in the same price segment across the country. According to the data, the greatest share of Rogersville, TN properties falls in the '$100,000 to $124,999' range, which is lower than the most significant median property across the country.
Property Taxes
One of the most important aspects for property owners is the amount of property taxes. This graph shows distribution of property taxes in Rogersville, TN compared to median property taxes around the country. The prevalent amount of property taxes in Rogersville, TN equals $1150, which is less than the national average.