Sidney, OH 45365, USA apartments for sale
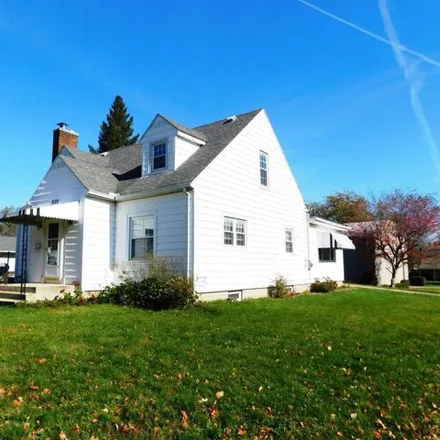
$189,900
$189,900
Available: Right Now
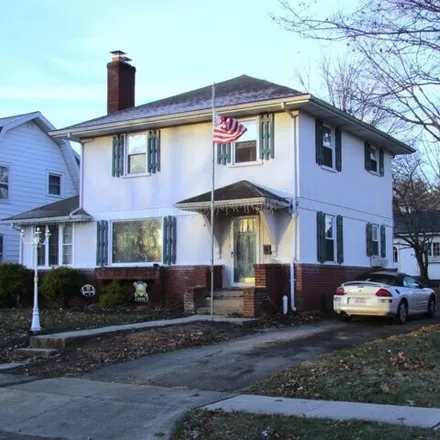
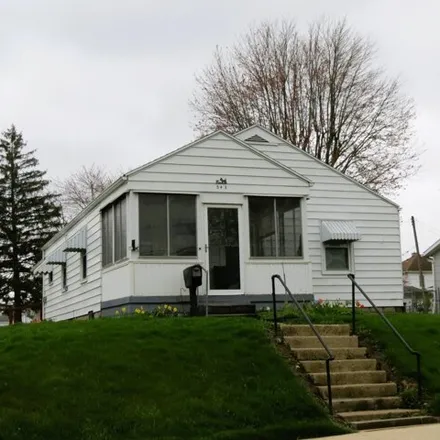
This spacious 2300+SF 3 bedroom/ 2 1/2bath Cape Cod, on a double corner lot, is just waiting for a new owner to make new memories. Huge 1st floor master suite with unique retro bath. 2 large 2nd floor bedrooms with full bath and abundance of closet a...
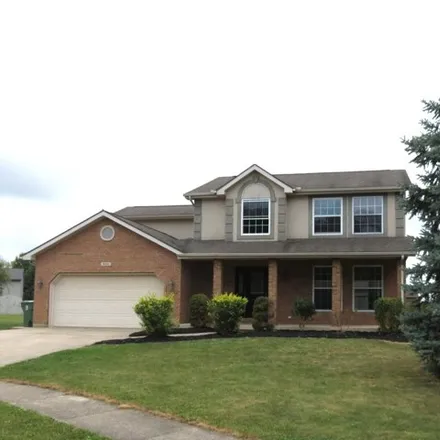
$299,000
$299,000
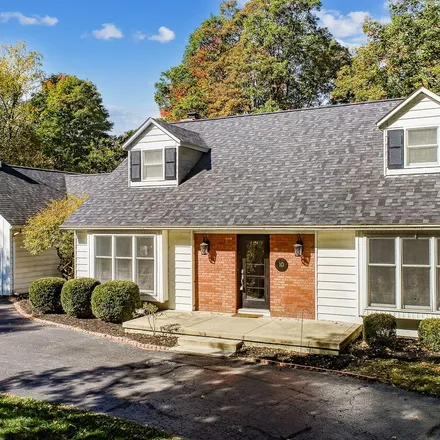
Available: Right Now
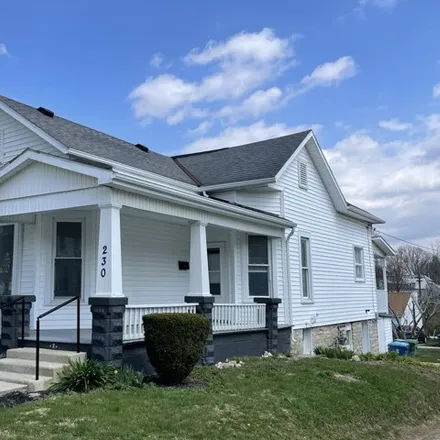
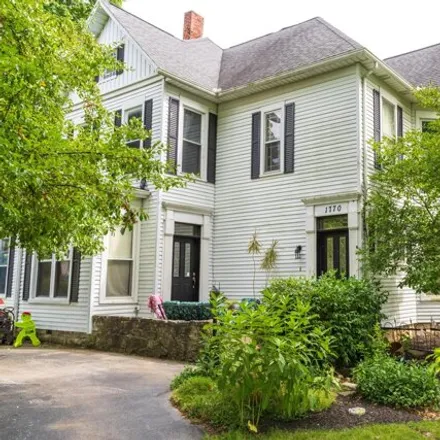
Looking for that perfect family sized home? Enjoy2, 301sq. ft. of living that has just been restored to like new condition with a mammoth cleaning, new carpet and flooring, fresh interior paint throughout and including all of the ceilings with new st...
$255,000
$255,000
Available: Right Now
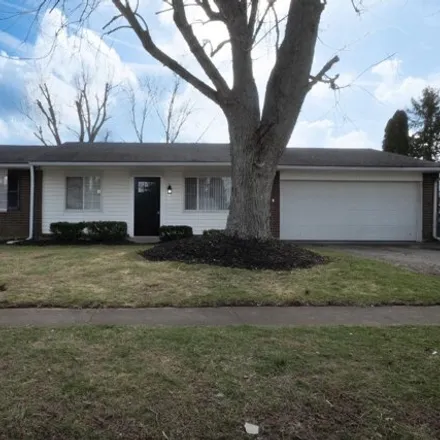
$199,900
$199,900
Available: Right Now
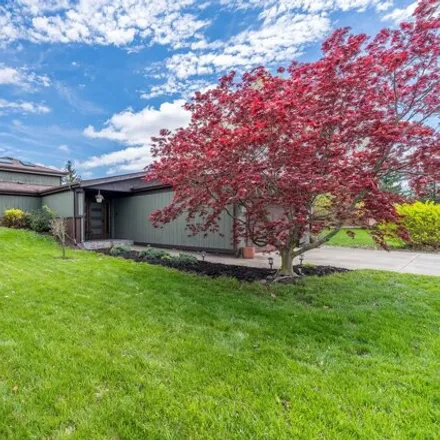
Fully remodeled (February 2024) ranch on slab in the beautiful Riverbend Hills Subdivision. 3 bedrooms, one with ensuite half bath. One full bath complete with elegant tilework. Kitchen includes appliances. Spacious two car garage with attic storage....
$476,900
$476,900
Available: Right Now
$89,900
$89,900
Available: Right Now
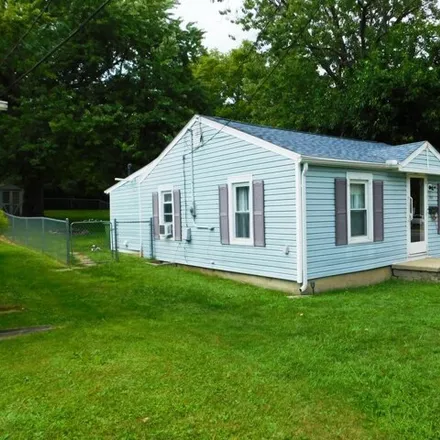
Freshly painted and updated vinyl plank flooring enhance this ''Cute and Cozy'' 2 bedroom single story home with convenience and comfort in mind. For those looking for a fantastic Starter home. Why pay rent when you could own for less?!? Investors lo...
$149,500
$149,500
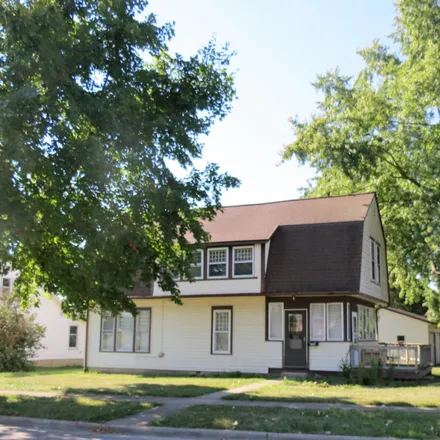
Available: Right Now
This charming two story home is waiting for you to make it your own. 3 bedrooms with a large bonus room that could be used as a 4th bedroom or an office. Wood floors, arched door ways, and plenty of natural light give the home a light and airy feel. ...
$579,000
$579,000
Available: Right Now
Absolutely beautiful home located on the north end of Sidney. This home features 4-5 bedrooms along with 4 1/2 baths. An open concept design that effortlessly blends spaciousness and charm. On the main floor you will find an office area, perfect for ...
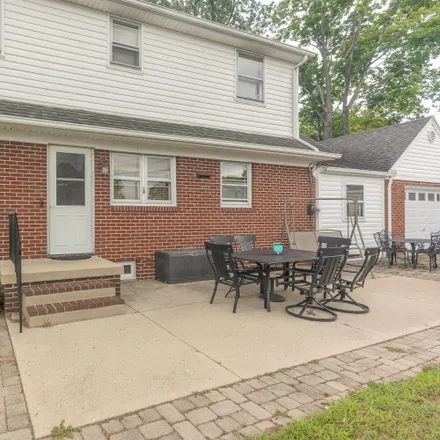
$167,000
$167,000
Available: Right Now
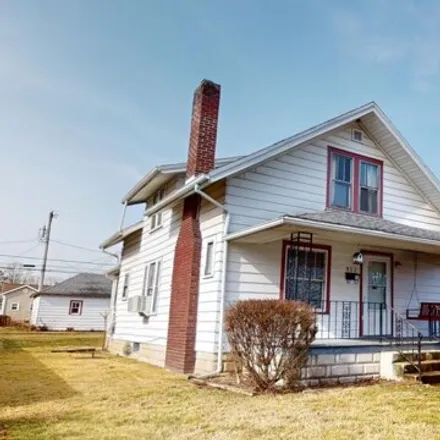
Located near I-75 on a tree lined street. This1, 692s/f home has 3 beds, 1.5 baths and hardwood floors. Family sized living room w/ fireplace leads to a sunroom and formal dining room. Full basement. Large covered and screened patio makes for relaxin...
$443,900
$443,900
Available: Right Now
$369,500
$369,500
Available: Right Now
$432,900
$432,900
Available: Right Now
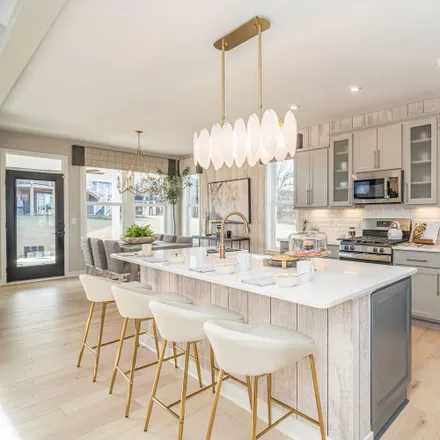
Tour Our Decorated Charles ModelThe Charles floorplan by Fischer Homes is both functional and stylish.. The open-concept design showcases a large island kitchen, bright morning room, and soaring two-story great room. A private owner's suite can be fo...
$169,000
$169,000
Available: Right Now
$73,500
$73,500
Available: Right Now
$165,000
$165,000
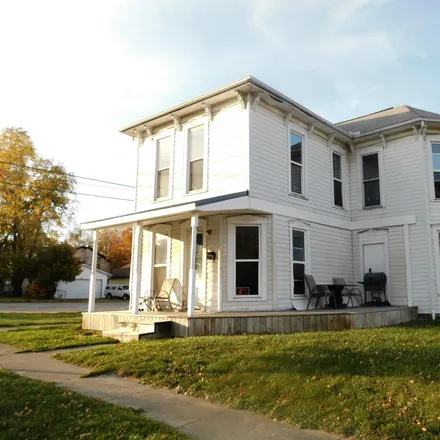
Available: Right Now
Just in time for Spring and Summer! This immaculate 2 bedroom, 1 bath ranch home offers a complete kitchen and laundry, a separate dining and living room, and the best enclosed porch around providing a rest stop for watching the world go by...more fu...
$134,900
$134,900
Available: Right Now
Adorable home recently renovated with original woodwork and plenty of character still in-tact. Large front porch, back balcony off of kitchen, walkout basement and huge yard. Three bedrooms, living room, eat-in kitchen, large pantry/storage closet, p...
$325,000
$325,000
Available: Right Now
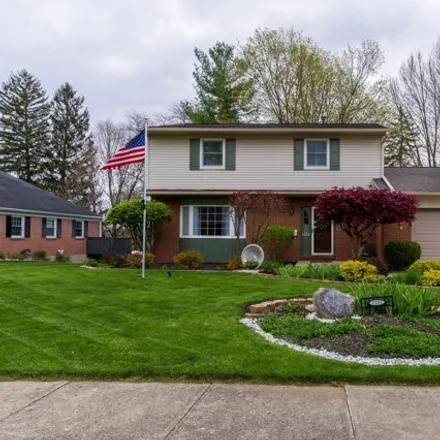
Immaculate 4 bedroom 2 story home located on a beautiful property...Welcoming curb appeal with eye catching landscaping invite you into this lovely family home...Fall in love with the spaciousness of the rear yard that includes a fenced in por...
$93,600
$93,600
Available: Right Now
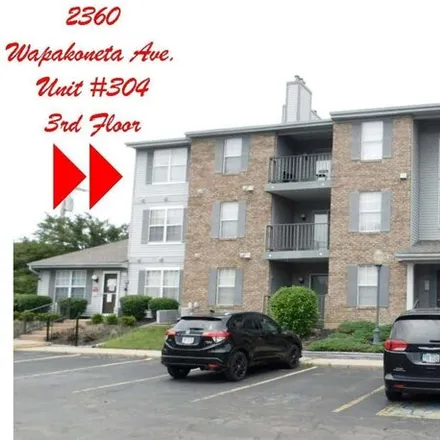
Investor alert ! Condo was recently rented on a one year lease. buy and immediately add a turnkey, cash flow property to your portfolio !. Don't want to spend your ''free time'' cutting the grass and taking care of outside maintenance, ...
$475,000
$475,000
Available: Right Now
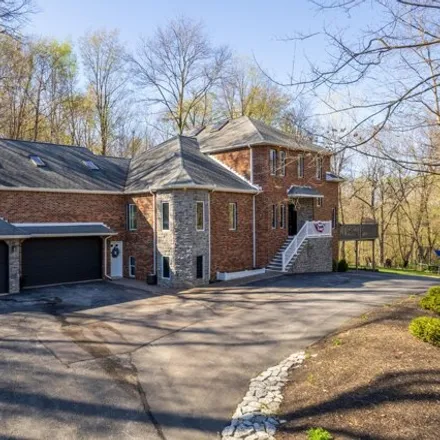
Country lifestyle close to the conveniences of the city. This amazing 2.26 acre property has a producing apple orchard, fenced in-ground heated pool with slide for hours of enjoyment. Circa 1896 massive barn has new metal roof, upgraded electric and ...
$339,900
$339,900
Available: Right Now
Beautiful 3 bedroom, 2 bath ranch with a 2-car attached garage on a fenced almost half acre lot. This home is so gorgeous and bright with natural light from the atrium skylights and the wall of French doors and floor to ceiling windows. The chef's ki...
$229,000
$229,000
Available: Right Now
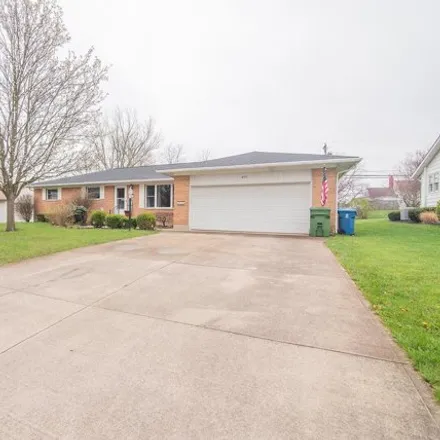
This home built in 1961 is a spacious, ranch style home with an all brick exterior. The attached 2-car garage and fenced yard compliment the exterior as well as the large concrete driveway and patio in the back yard. Features a formal front room, lar...
$148,000
$148,000
Available: Right Now
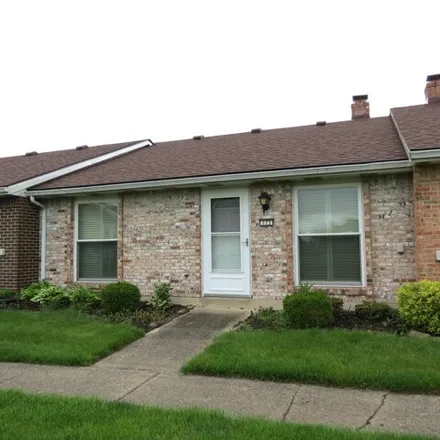
At Last! A 2 bedroom, 2 full bath condo in Sidney's North End. Nearly1, 200sq. ft. of living with a fully equipped eat-in kitchen and laundry room. (All appliances are in place.) The formal dining room makes a perfect office and a 20' by 13' living r...
Sidney
According to statistics, the population in Sidney, OH amounts to 20,777, which shows decline 0% compared to the previous year. The median age of the city’s residents is 37. The average household income is $47,098, shifting decline 1% from the past year, and the average property value in Sidney, OH growth 1% to $110,600 throughout the year.
What is the Average Price of Apartments for Sale in Sidney, OH, 45365?
| Month | Median Price |
|---|---|
| Mar 2024 |
$222,666
|
| Feb 2024 |
$222,666
|
| Jan 2024 |
$222,666
|
| Dec 2023 |
$222,666
|
| Nov 2023 |
$231,627
|
| Oct 2023 |
$259,981
|
Household Income
The average household income in Sidney, OH grew from $46,697 to $47,098 in the past year. This data is an estimate based upon 8,419 households in Sidney, OH . The chart below presents how household income is distributed in Sidney, OH in comparison to the revenue allocation amid households nationally.
Property Value
According to data from last year, the average property value in Sidney, OH shifted from $109,500 to $110,600 throughout the year. The subsequent graph indicates the share of properties in the given price range in Sidney, OH in comparison to the median property value in the same price segment across the country. According to the data, the greatest share of Sidney, OH properties falls in the '$100,000 to $124,999' range, which is lower than the most significant median property across the country.
Property Taxes
One of the most important aspects for property owners is the amount of property taxes. This graph shows distribution of property taxes in Sidney, OH compared to median property taxes around the country. The prevalent amount of property taxes in Sidney, OH equals $1150, which is less than the national average.