Solon, IA 52333, USA apartments for sale
$409,900
$409,900
Available: Right Now
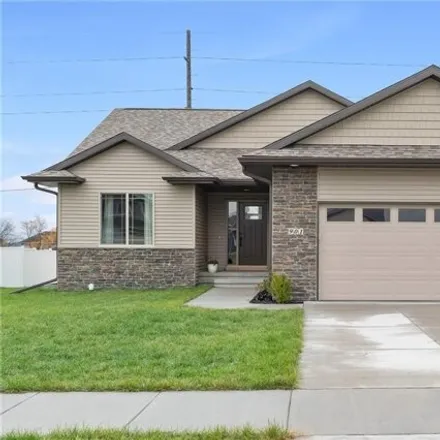
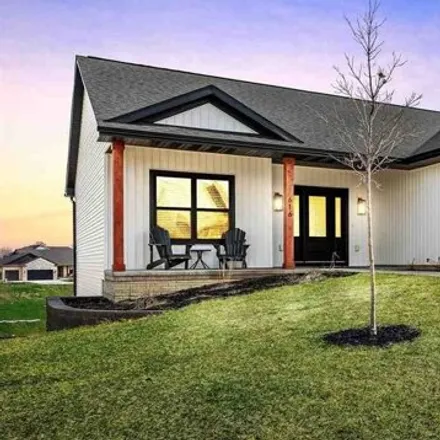
Location Location Location. This better than new home sits right across the street from the Solon prairie, a three-acre prairie relict, which provides a dazzling display of color each year and contains more than 157 native plant species. It's also si...

$599,900
$599,900
Available: Right Now
Open floor plan in this pondview Windmill Estates Ranch. Large great room filled with natural light. Master also has pond views, huge walk in closet and luxurious master bath with soaking tub, tile shower and double sinks. Lower level has large famil...
$559,900
$559,900
Available: Right Now
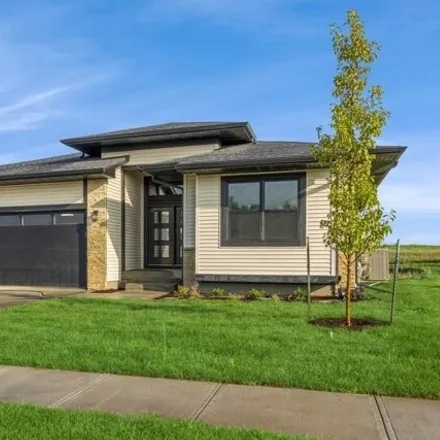
New Watts Group Construction in Trail Ridge Estates, a new community in Solon. Ranch style home with open floor plan that walks out to covered deck. Primary bedroom with private en-suite on main level. The walkout LL features a Family/Game Rm area th...

$649,900
$649,900
Available: Right Now
This beautiful Hodge Construction built home overlooks Saddleback Ridge golf course. These single family homes, organized as detached condos, come with the luxury of snow removal, mowing and landscaping maintained by the HOA, insurance and exterior h...

$260,000
$260,000
Available: Right Now
Like-new condo with an open floor plan! You will be welcomed by the spacious living room with vaulted ceilings, LVP floors and slider to the deck. Beautiful kitchen with stainless steel appliances, breakfast bar, and pantry. Primary suite with walk-i...
$230,000
$230,000
Available: Right Now
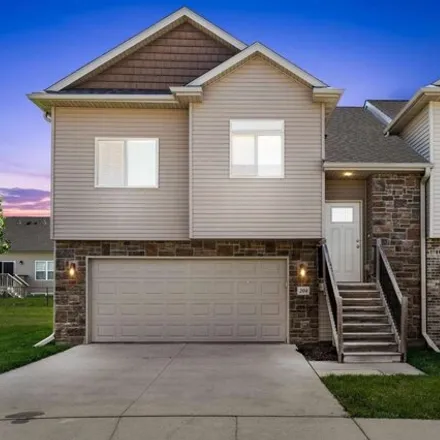
Comfort and convenience meet in this spacious end unit townhome on a cul-de-sac in the cozy town of Solon. Located close to local amenities, parks, and schools, and just a short drive toCR/IC.Inviting vaulted ceilings in the main living room and slid...
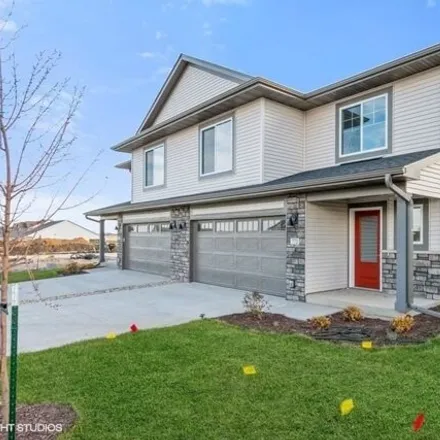
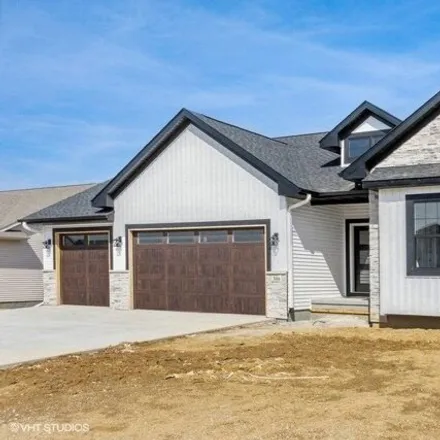
$439,900
$439,900
Available: Right Now
Just Finished, this garden view ranch plan located in Solon's Old Mill Subdivision. The house features 4 bedrooms, 3 bathrooms, and 2300 square feet of living space. Luxury vinyl plank flooring is installed in the living room, dining area, and kitche...
$324,900
$324,900
Available: Right Now
New Watts Group Construction in Trail Ridge Estates, a new community in Solon. This 2-Story home features 3 spacious bedrooms including a generous sized primary suite with a private bath, and large walk-in closet on the upper level. Open kitchen desi...
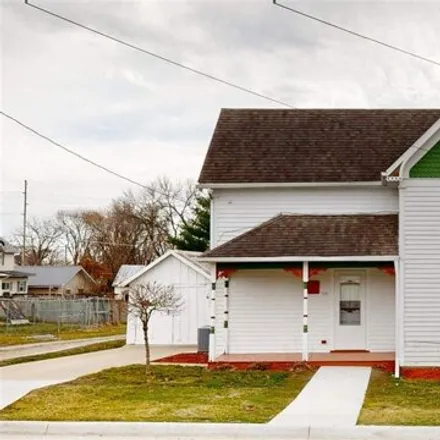
$268,000
$268,000
Available: Right Now
Wonderfully maintained, turn of the century home in the heart of Solon. You will find thoughtful updates throughout the home from fresh paint to new radiator covers. Original woodwork and old-world craftsmanship shine throughout, seamlessly melding t...
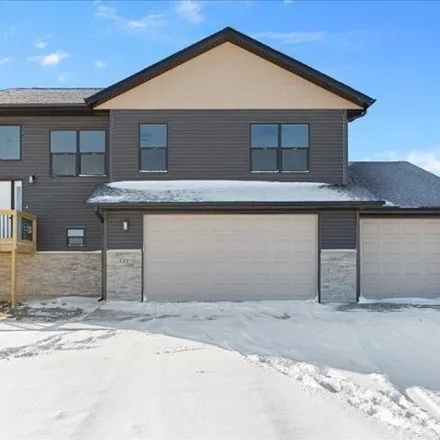
$262,000
$262,000
Available: Right Now
End Unit Condo Available for Quick Possession! This one owner 3 bedroom, 3 bathroom townhome has a fully finished walk-out lower level and a fenced in yard. The main level has two bedrooms, two bathrooms, a large kitchen with stainless steel applianc...
$799,999
$799,999
Available: Right Now
In the coveted Solon area, this home epitomizes architectural elegance across three levels, showcasing upscale finishes. It features the latest design trends: natural wood, stainless appliances, open shelving, a tuxedo kitchen, and painted cabinetry....
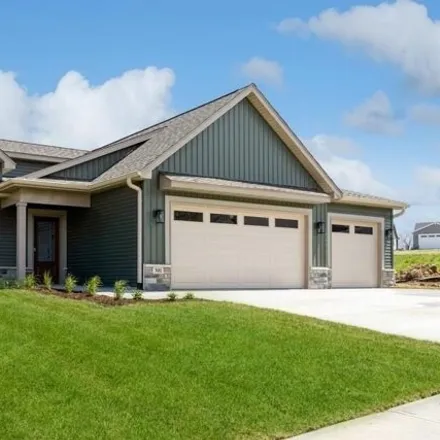
$634,900
$634,900
Available: Right Now
New Watts Group Construction in Trail Ridge Estates, a new community in Solon. Ranch style home featuring a primary suite on the main level that includes a private bath and walk in closet, open LR/DR/Kit area that opens to a screen porch and grill de...
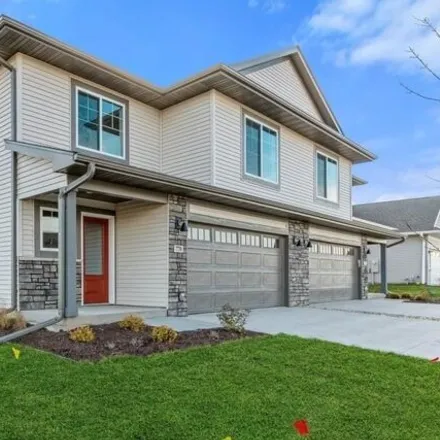
$439,900
$439,900
Available: Right Now
New Watts Group Construction in Trail Ridge Estates, a new community in Solon. This multi-level floorplan has the bedrooms in the upper level including the primary ensuite, 2 additional bedrooms and an additional bathroom. The main level is an open k...

$879,900
$879,900
Available: Right Now
Beautiful Hodge Construction built ranch style home overlooking Saddleback Ridge Golf Course. These single family homes, organized as detached condos, offer the luxury of snow removal, mowing and landscaping maintained by the HOA, insurance and exter...
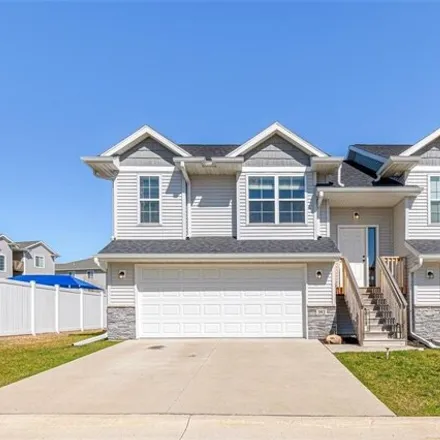
$324,900
$324,900
Available: Right Now
New Watts Group Construction in Trail Ridge Estates, a new community in Solon. This 2-Story home features 3 spacious bedrooms including a generous sized primary suite with a private bath, and large walk-in closet on the upper level. Open kitchen desi...
$400,000
$400,000
Available: Right Now
New Construction Split foyer single family home with 4 Bedrooms, 3 Baths and almost 2400 finished sqft. Luxury vinyl plank flooring through your main level kitchen, dining and living room. White painted Cabinets, Trim and Doors. Black finished hardwa...

$370,000
$370,000
Available: Right Now
In the heart of Solon, on an almost half acre private lot, don't miss your chance to make this great home your own! Walk up to the inviting front porch with porch swing and into the welcoming open floor plan with vaulted ceiling and gas fireplace. Ou...
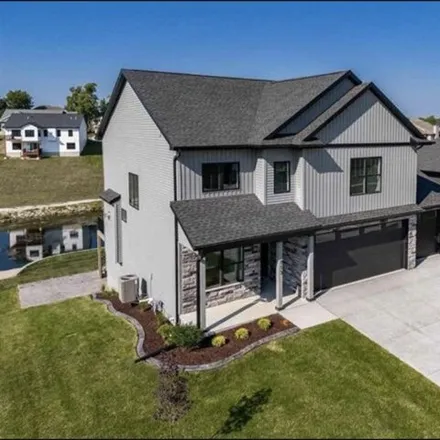
$560,000
$560,000
Available: Right Now
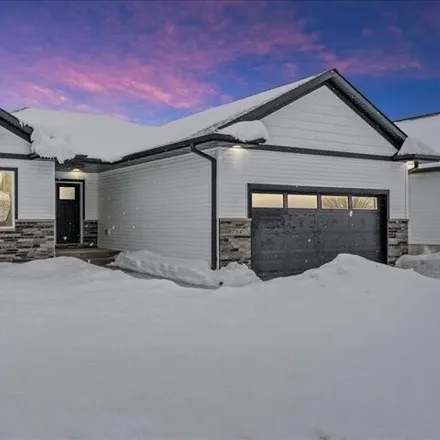
Almost brand new walkout ranch with pond views where modern elegance meets comfort. This beautifully designed residence offers both luxury and practicality, featuring hard surface flooring throughout the main level and upgrades galore. As you step in...

$699,900
$699,900
Available: Right Now
Watts Group New Construction in Trail Ridge Estates, a new home community in Solon. This 2-Story home has 5 bedrooms and 3.5 bathrooms. The upper level has 4 spacious bedrooms including a generous sized primary suite with a private bath, and large wa...
$499,900
$499,900
Available: Right Now
If it is space you need ? I HAVE IT ! In this five bedroom three and a half bath custom built home, attention to detail is obvious with extra wide trim, quartz counter tops through out, all stainless steel appliances, high quality plank flo...

$80,000
$80,000
Available: Right Now
Welcome to a quaint condo in the heart of Solon. An opportunity to join Solon Retirement Village of 55+ living with activities and independent living. This unit has 1 bedroom 1 bathroom and a view of green space from the deck! Galley kitchen is open ...
$314,900
$314,900
Available: Right Now
New Watts Group Construction in Trail Ridge Estates, a new community in Solon. This 2-Story townhome style zero-lot features 3 spacious bedrooms including a generous sized primary suite. Open kitchen design with island and pantry walks out to covered...
Solon
According to statistics, the population in Solon, IA amounts to 2,485, which shows growth 4% compared to the previous year. The median age of the city’s residents is 35. The average household income is $71,750, shifting decline -3% from the past year, and the average property value in Solon, IA growth 8% to $215,200 throughout the year.
What is the Average Price of Apartments for Sale in Solon, IA, 52333?
| Month | Median Price |
|---|---|
| Jun 2024 |
$531,696
|
| May 2024 |
$559,570
|
| Apr 2024 |
$538,424
|
| Mar 2024 |
$538,424
|
| Feb 2024 |
$538,424
|
| Jan 2024 |
$538,424
|
| Month | Median Price |
|---|---|
| Jun 2024 |
$477,659
|
| May 2024 |
$525,480
|
| Apr 2024 |
$469,296
|
| Mar 2024 |
$469,296
|
| Feb 2024 |
$469,296
|
| Jan 2024 |
$469,296
|
Household Income
The average household income in Solon, IA declined from $73,750 to $71,750 in the past year. This data is an estimate based upon 882 households in Solon, IA . The chart below presents how household income is distributed in Solon, IA in comparison to the revenue allocation amid households nationally.
Property Value
According to data from last year, the average property value in Solon, IA shifted from $199,600 to $215,200 throughout the year. The subsequent graph indicates the share of properties in the given price range in Solon, IA in comparison to the median property value in the same price segment across the country. According to the data, the greatest share of Solon, IA properties falls in the '$150,000 to $174,999' range, which is lower than the most significant median property across the country.
Property Taxes
One of the most important aspects for property owners is the amount of property taxes. This graph shows distribution of property taxes in Solon, IA compared to median property taxes around the country. The prevalent amount of property taxes in Solon, IA equals $3000, which is less than the national average.