Sterling City, TX 76951, USA apartments for sale
$525,000
$525,000
Available: Right Now
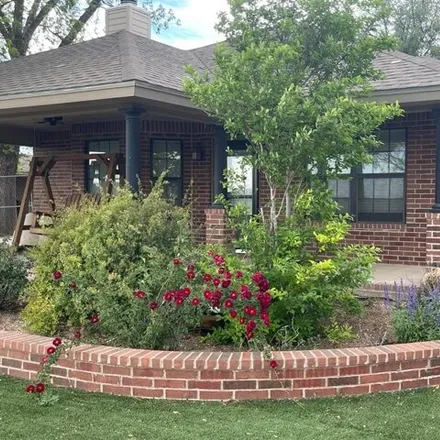
Looking for small town living, then look no further! Check out this beautifully updated and completely remodeled 4 Bedroom/3 Bathroom home in Sterling City. This gorgeous home features split bedrooms, with 2 master bedrooms w/large walk in closets, 2...
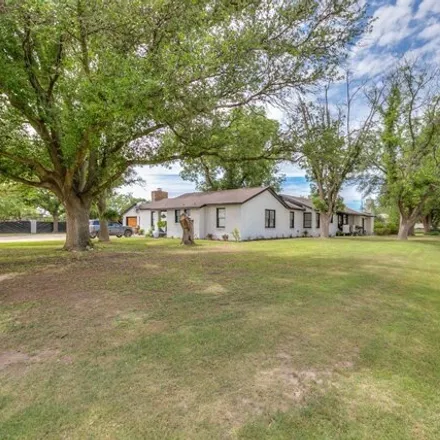
$127,500
$127,500
Available: Right Now
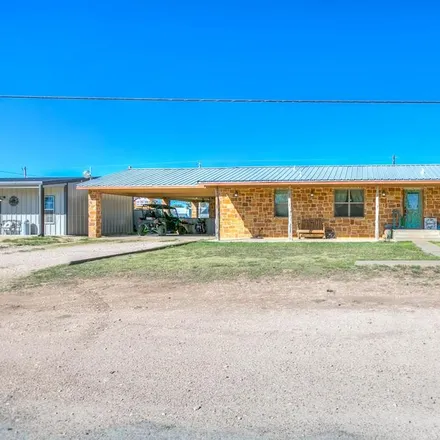
$400,000
$400,000
Available: Right Now
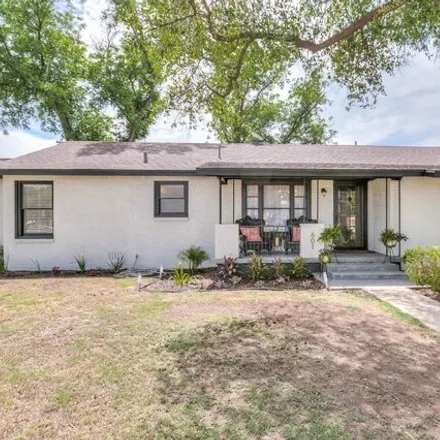
$525,000
$525,000
Available: Right Now
Looking for small town living, then look no further! Check out this beautifully updated and completely remodeled 4 bedroom/3 bathroom home in Sterling City. This gorgeous home features split bedrooms, with 2 Master bedrooms w/large walk in closets, 2...
$439,900
$439,900
Available: Right Now
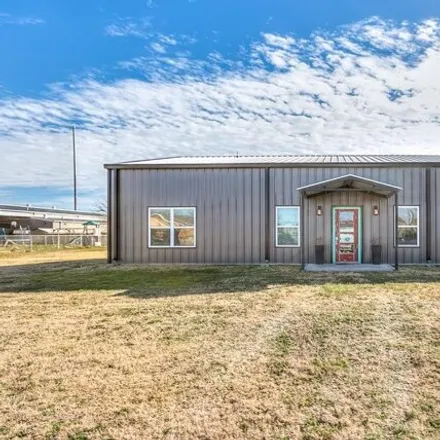
Looking for a Newer home the Sterling City school district and walking distance to the school? Look no further! This Beautiful Barndominium is less than 5 yrs old and sits on.387 of an acre! With right at2, 400sq ft, 3 Bedrooms and 2 Bathrooms...
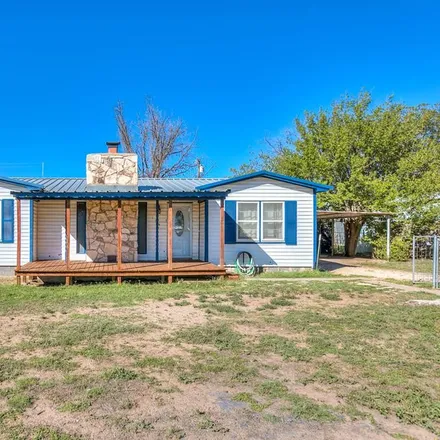
$319,000
$319,000
Available: Right Now
Beautiful little oasis right in town. This 2 bedroom, 1 bath with 2 half baths home has all kinds of things just for you. 2 car garage, with an extra carport, and huge closet. Currently being used as an extra room, its that big! The back yard has a p...
Sterling City
According to statistics, the population in Sterling City, TX amounts to 953, which shows decline -2% compared to the previous year. The median age of the city’s residents is 44. The average household income is $45,938, shifting decline -2% from the past year, and the average property value in Sterling City, TX decline -45% to $49,500 throughout the year.
Household Income
The average household income in Sterling City, TX declined from $46,875 to $45,938 in the past year. This data is an estimate based upon 361 households in Sterling City, TX . The chart below presents how household income is distributed in Sterling City, TX in comparison to the revenue allocation amid households nationally.
Property Value
According to data from last year, the average property value in Sterling City, TX shifted from $89,400 to $49,500 throughout the year. The subsequent graph indicates the share of properties in the given price range in Sterling City, TX in comparison to the median property value in the same price segment across the country. According to the data, the greatest share of Sterling City, TX properties falls in the '$40,000 to $49,999' range, which is lower than the most significant median property across the country.
Property Taxes
One of the most important aspects for property owners is the amount of property taxes. This graph shows distribution of property taxes in Sterling City, TX compared to median property taxes around the country. The prevalent amount of property taxes in Sterling City, TX equals $800, which is less than the national average.