Streator, IL 61364, USA apartments for sale
$149,900
$149,900
Available: Right Now
Recently refurbished a two-unit building situated in the heart of town. You have the opportunity to reside in one unit while leasing out the other or consider it as a lucrative investment property. The premises feature a newly installed roof, upgrade...
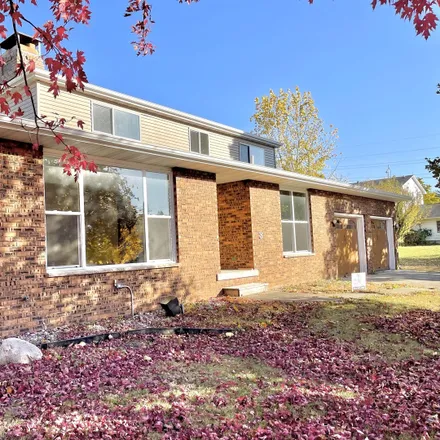
$355,000
$355,000
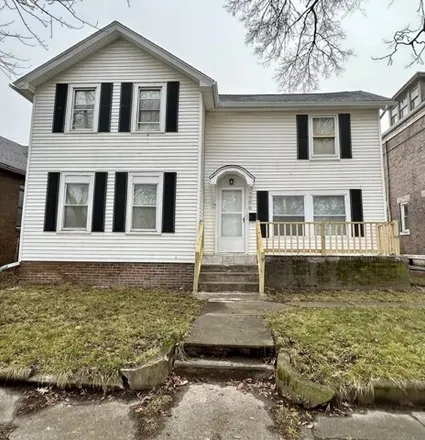
Available: Right Now
Lots of room in this five bedroom home with four full bathrooms. Beautiful sunroom/family room with fireplace and unique windows that bring in lots of sunlight and sliding doors lead out to a large deck with vinyl railing. Large kitchen with breakfas...
$139,900
$139,900
Available: Right Now
Don't miss out on this 3 bed 1.5 bath ranch home in the desirable Oak Hill Subdivision near the Vermillion. Attached 1 car garage, 2 storage sheds and spacious back yard. Main level has a large living room/ dining room combo with a fireplace and buil...
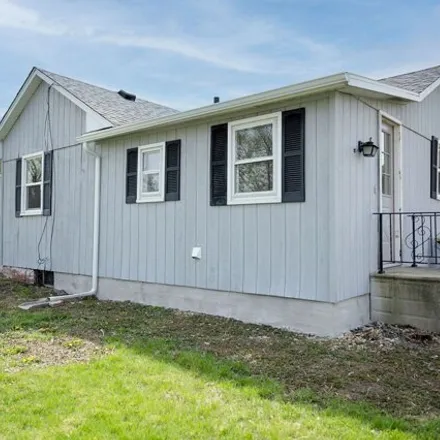
$199,000
$199,000
Available: Right Now
Featuring2, 196square feet, vaulted wood-beam ceilings, and located on over a half acre of serene surrounding, this well-maintained 3 bedroom, 1.75 bathroom brick ranch home provides the amenities many desire. Approaching the property, you find a pri...
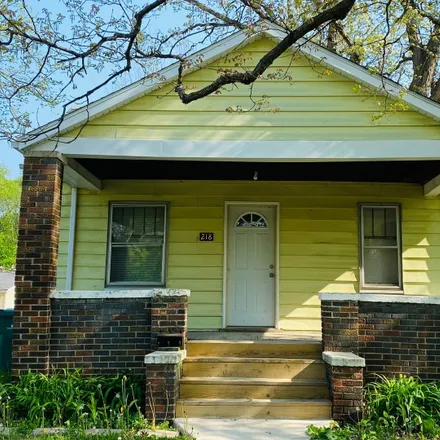
$84,500
$84,500
Available: Right Now
Rehabbed and remodeled with so many NEW features! Just steps away from Kimes Elementary School, this home would make a great first home or a rental for a turn-key investor. Updates include new roof, flooring, paint, bathroom, kitchen, water heater an...

$74,000
$74,000
Available: Right Now
Welcome to this 3 bedroom, 1 bathroom home showcasing1, 223square feet including a spacious living room, separate dining room, kitchen with table space, family room, main level laundry, and desirable closet space. The exterior of the home features a ...
$139,000
$139,000
Available: Right Now
This newly remodeled 2-unit property offers versatility and convenience, making it an ideal choice for investors or homeowners looking for rental income. Situated at the edge of downtown Streator, this property boasts modern finishes and updates thro...
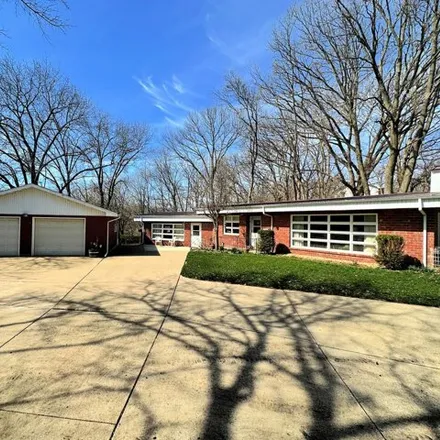
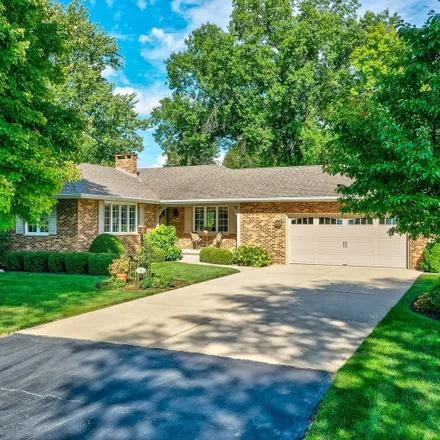
$160,000
$160,000
Available: Right Now
This stunning, nicely updated ranch with a walkout basement boasts: An updated kitchen with gray custom cabinets with crown, white quartz counters, breakfast bar, custom backsplash and luxury vinyl plank flooring; Living room with beamed ceiling, coz...
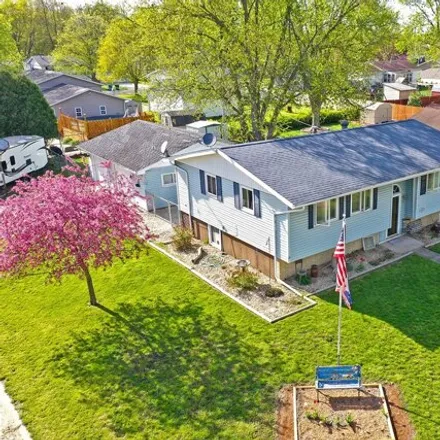
$145,000
$145,000
Available: Right Now
Raised ranch with over 1900sf featuring 3-4 bedrooms, 2 bathrooms, corner lot with fenced in backyard, and a detached 2 car garage with a concrete driveway. Elegant kitchen with eat in table space and easy exterior access to deck and backyard. Finish...
$83,900
$83,900
Available: Right Now
Updated home and ready for a new owner ! Refinished hardwood floors ! Home offers a large kitchen with granite couter tops and new sink ! Freshly painted interior and exterior ! This property comes with a full basement ...
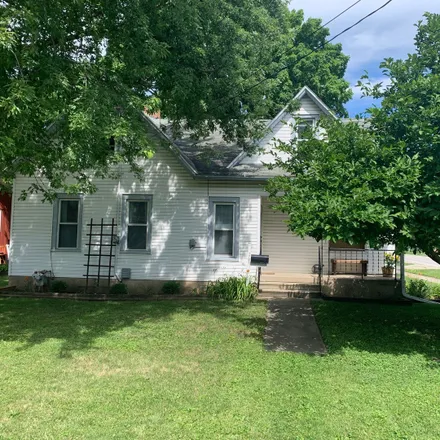
$45,000
$45,000
Available: Right Now
Much potential in this Streator property on a double lot! 2 bedroom home with 2 car detached garage. Eat-in kitchen with walk-in closet, living room with original hardwood flooring. Bedrooms with hardwood flooring. Walk-out basement also offers insid...
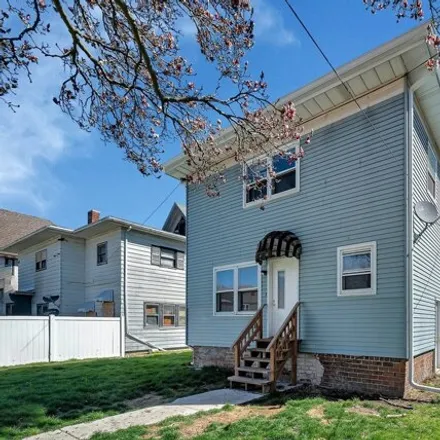
$118,000
$118,000
Available: Right Now
Don't miss this charming diamond in the rough! Spacious 2 story brick home with 6 bedrooms, 1.5 bath, built-ins, enclosed porch and dry basement. 5th or 6th bedrooms may be a family room or office. Home has a fenced yard, 2 car garage with parking sp...
$349,000
$349,000
Available: Right Now
With over4, 000square feet of finished space, an abundance of character, and 1.88 acres of land, while being located in town, this home stands out from the rest. The home features 3 finished levels above ground as well as a finished full basement. Im...
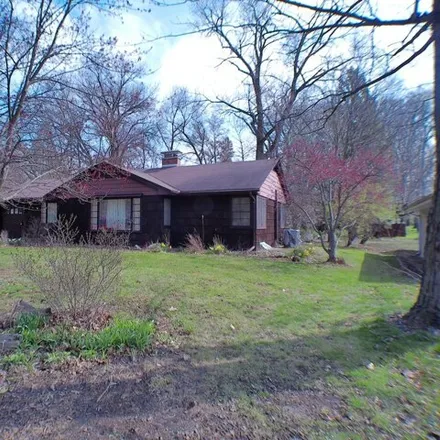
$74,500
$74,500
Available: Right Now
$114,900
$114,900
Available: Right Now
$95,000
$95,000
Available: Right Now
$239,000
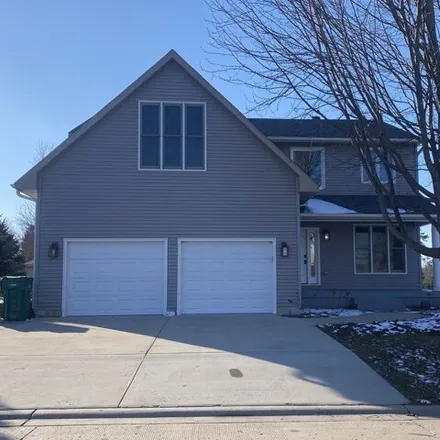
$239,000
Available: Right Now
$280,000
$280,000
Available: Right Now
Have you been looking for luxury? Look no further than right here at 3 Schmitt Dr. Streator Il! Located right beyond city limits but still within distance of everything the town has to offer. This newly rebuilt home offers you a beautiful living room...
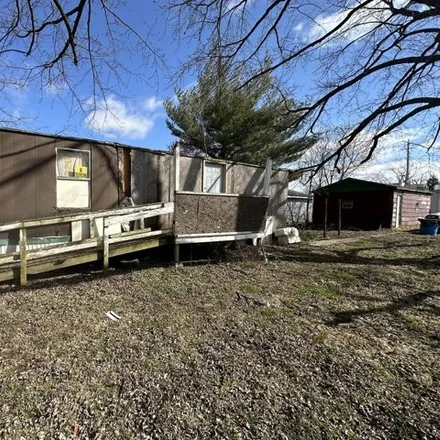
$20,000
$20,000
Available: Right Now
Mobile home with 1 car garage on 50x140 lot. Great opportunity. Property is zoned C3 general commercial. Per Streator, mobile home is grandfathered and could be used as a residence. Sold as is....

$55,000
$55,000
Available: Right Now
Three bedroom one bath home being sold as is. Large two car detached garage. Full basement...
$180,000
$180,000
Available: Right Now
Step inside this 3 bed 2 bath home with a 2 car attached garage, outdoor shed, and partial finished basement. This home also has a large deck off the living room and includes a newer roof 2021....
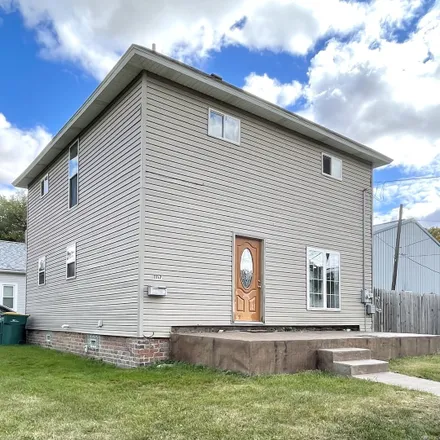
$69,000
$69,000
Available: Right Now
Move in ready- Freshly Painted and Updated- The Open Floor Plan (2-3) Bedroom, (1) Bathroom Home offer spacious living. New flooring throughout the home. The third room could be a nursery or home office. The bathroom has a walk in tiled shower...
Streator
According to statistics, the population in Streator, IL amounts to 13,241, which shows decline 1% compared to the previous year. The median age of the city’s residents is 40. The average household income is $42,043, shifting growth 3% from the past year, and the average property value in Streator, IL decline -5% to $78,900 throughout the year.
Household Income
The average household income in Streator, IL grew from $40,688 to $42,043 in the past year. This data is an estimate based upon 5,258 households in Streator, IL . The chart below presents how household income is distributed in Streator, IL in comparison to the revenue allocation amid households nationally.
Property Value
According to data from last year, the average property value in Streator, IL shifted from $83,200 to $78,900 throughout the year. The subsequent graph indicates the share of properties in the given price range in Streator, IL in comparison to the median property value in the same price segment across the country. According to the data, the greatest share of Streator, IL properties falls in the '$60,000 to $69,999' range, which is lower than the most significant median property across the country.
Property Taxes
One of the most important aspects for property owners is the amount of property taxes. This graph shows distribution of property taxes in Streator, IL compared to median property taxes around the country. The prevalent amount of property taxes in Streator, IL equals $3000, which is less than the national average.