Tulelake, CA 96134, USA apartments for sale
$185,000
$185,000
Available: Right Now
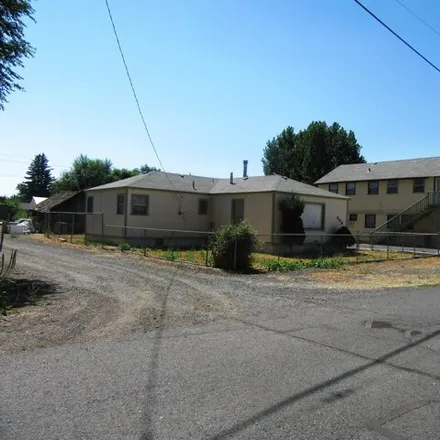
Located in Tulelake, a 3 bedroom, 1 bath single story home with Large kitchen and living rooms, 1 detached 1 car garage and fully fenced yard, laundry room and pantry room. Comes with a 2 story vacant commercial bldg previously used as a church. Home...

$120,000
$120,000
Available: Right Now
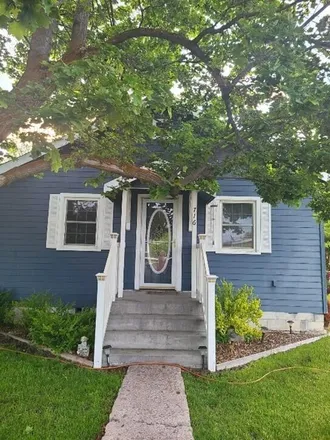
Wow! This completely freshened up, super cute home in Tulelake is what you've been waiting for! It has two bedroom spaces (though the second bedroom/office space is non-conforming) and one large bathroom which is attached to the primary bedroom. It a...
$120,000
$120,000
Available: Right Now
Super cute in Tulelake! This 2 Bedroom, 1 Bath cottage has been in the family for decades. Features include; newer siding & exterior paint, concrete perimeter foundation, updated breaker box, Monitor oil heater, newer windows, eat in kitchen, and lau...
Tulelake
According to statistics, the population in Tulelake, CA amounts to 913, which shows decline -12% compared to the previous year. The median age of the city’s residents is 34. The average household income is $31,467, shifting growth 1% from the past year, and the average property value in Tulelake, CA decline -3% to $76,300 throughout the year.
Household Income
The average household income in Tulelake, CA grew from $31,094 to $31,467 in the past year. This data is an estimate based upon 317 households in Tulelake, CA . The chart below presents how household income is distributed in Tulelake, CA in comparison to the revenue allocation amid households nationally.
Property Value
According to data from last year, the average property value in Tulelake, CA shifted from $78,300 to $76,300 throughout the year. The subsequent graph indicates the share of properties in the given price range in Tulelake, CA in comparison to the median property value in the same price segment across the country. According to the data, the greatest share of Tulelake, CA properties falls in the '$60,000 to $69,999' range, which is lower than the most significant median property across the country.
Property Taxes
One of the most important aspects for property owners is the amount of property taxes. This graph shows distribution of property taxes in Tulelake, CA compared to median property taxes around the country. The prevalent amount of property taxes in Tulelake, CA equals $800, which is less than the national average.