Wellington, CO 80549, USA apartments for sale

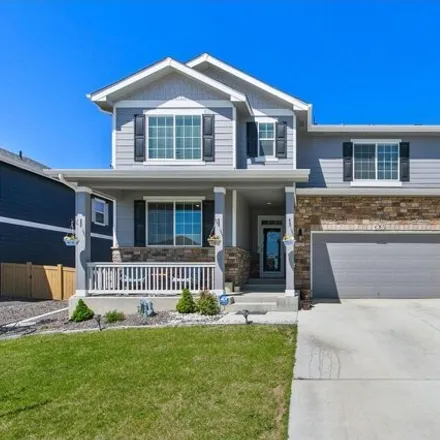
$785,000
$785,000
Available: Right Now
Immaculate 4-bedroom home on just over an acre in Wellington's coveted Wellington West neighborhood! This beautiful property has been thoughtfully updated and remodeled in recent years. From the classy wood grain porcelain tile on the main level -- t...
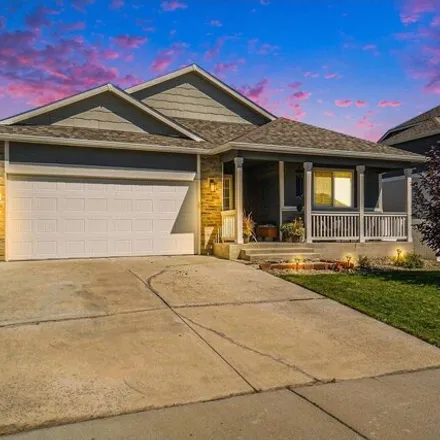
$475,000
$475,000
Available: Right Now
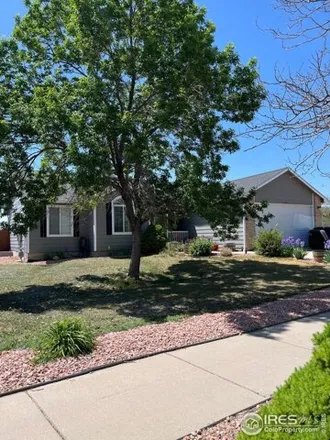
NO Metro!! This is your next ranch style home! You can't go wrong if you invest in this neighborhood. The lots are larger than most and you have open farmland and mountains for your view! This home has a new roof, exterior paint, furnace, water heate...

$499,999
$499,999
Available: Right Now
This Energy Free Living ranch-style home features 5-bedroom, 3-bathroom, spanning2, 838square feet and sits on a.2-acre lot with no HOA or Metro District restrictions, allowing you to have the freedom to personalize your property. Designed for energy...
$479,900
$479,900
Available: Right Now
4 Level Upgraded Michigan Model in Wellington w/Entire Owned Solar System included and$2, 500Seller Concession towards the Interest Rate. On average $9 p/month Electric bill! Engineered Hardwood Floors, Tandem 3-Car Garage and private established Bac...
$575,000
$575,000
Available: Right Now
This home has the WOW factor! The open floor plan with a 15+ ceiling is warm and welcoming with a fireplace in the living room. Lots of windows allow natural light to fill this unique floor plan. The spacious primary retreat features a five piece bat...

$469,900
$469,900
Available: Right Now
4 bedroom, 3 bath home in Wellington located in Park Meadows! This well-kept home Features an Open floor plan, loft area, vaulted ceilings, oversized 3 car Tandem garage, large backyard, and much more! The unfinished daylight basement offers room to ...
$775,000
$775,000
Available: Right Now
Stunning Custom Ranch, 5 bed, 4 bath. A main floor bedroom makes for a perfect office space. Situated on a 1/2 acre corner lot in the sought after Wellington West neighborhood. Remodeled kitchen is a culinary delight with large Center Island, beautif...
$595,000
$595,000
Available: Right Now
Move-in ready 5 bedroom, 4 bathroom home with a 3 car garage in popular Sage Meadows! Spacious open floor plan on the main level which features a bedroom with adjacent full bathroom. The kitchen includes granite countertops, stainless steel appliance...

$425,000
$425,000
Available: Right Now
Jump at your opportunity for an affordable newer home with no HOA, no covenants, and no metro district! Built in 2015, this 3 bedroom, 2 bath is clean and in move-in condition with all appliances, including washer/dryer, included. Vaulted ceilings cr...

$600,000
$600,000
Available: Right Now
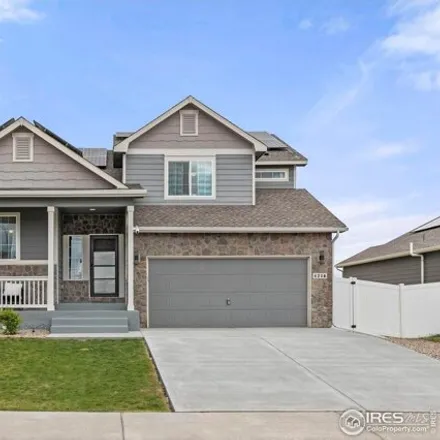
Welcome to this stunning Sage Built home, where quality construction meets incredible curb appeal and beautiful interior finishes. This charming residence offers the perfect blend of main-level convenience with additional space both upstairs and down...

$499,000
$499,000
Available: Right Now
Come and enjoy the quiet streets of Park Meadows, just a stone's throw from I-25 for easy commuting. As you walk up to the home, you'll notice the west facing, covered front porch, perfect for enjoying your morning coffee while soaking in the views o...

$539,900
$539,900
Available: Right Now
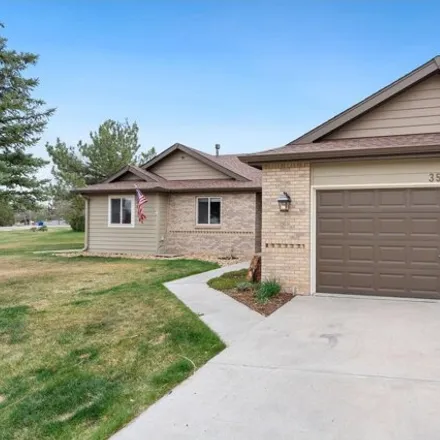
Quality and Sophistication built by Triple Crown Builders! What a fantastic home, withSO MANYupgrades and features! Bedecked with reliable wood flooring, open floor plan w/ vaulted ceilings and a cozy gas fireplace in the living room! WOW deluxe kitc...

$340,000
$340,000
Available: Right Now
Welcome to your dream townhome-style condo in the beautiful Wellington, Colorado! Featuring 2 generously sized bedrooms and 3 well-appointed bathrooms, this end-unit condo offers a meticulously cared-for interior. Enjoy the spacious 2-car attached ga...
$470,000
$470,000
Available: Right Now
Lender-paid 1% rate buy down for one year! This ranch home in Wellington Downs has everything you're looking for - main level has open living space with primary suite, additional two bedrooms and another full bath. Entertaining is easy thanks to the ...

$545,000
$545,000
Available: Right Now
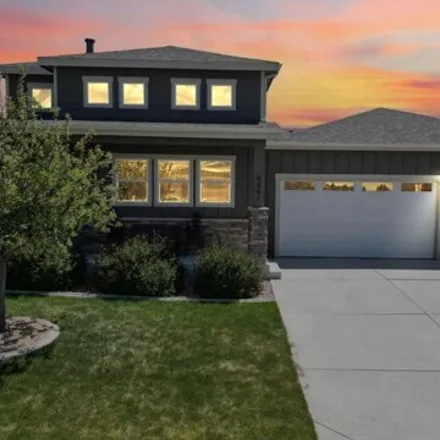
Smile, you're home! Welcome to this lovely upgraded home, situated on a private lot, complete with storage shed, gardens, mature trees, sprinklers and driplines. Take it all in while you relax in your new hot tub! Perhaps one of the best features of ...

$390,000
$390,000
Available: Right Now
Welcome to Westgate at Wellington Point! This townhome features an open floor plan and includes 3 bedrooms, 3 bathrooms, and a 1-car attached garage! There is a full unfinished basement with rough-ins for a bathroom. Radon Mitigation system. All appl...
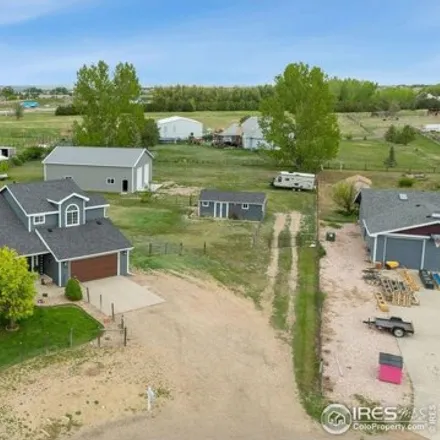
$830,000
$830,000
Available: Right Now
Live and thrive at your new in town acerage! Don't miss a rare opportunity to own a beautifully updated home in the coveted Fox Chase Estates. In one of the most premier lots, escape to your 1.5 acres of land with west facing views and no HOA! Fall i...
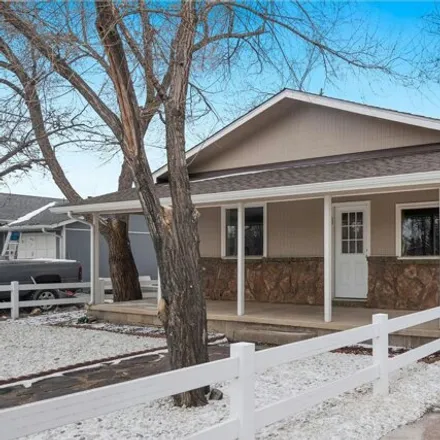
$374,900
$374,900
Available: Right Now
Seller offering a 1 year warranty. This Adorable Bungalow in old town Wellington has been completely remodeled! 2 Bedrooms, 1 bath. New roof with class 4 shingles, new electric, new floors, all new kitchen including, cabinets, granite countert...

$619,820
$619,820
Available: Right Now
$13, 000Lender Incentive! Ready to close in September 2024. Sage Homes is now building in the last phase of Sage Meadows located conveniently off Highway 1 with quick access to Fort Collins, Cheyenne and I-25. Sage Meadows is an established neighborh...
$455,000
$455,000
Available: Right Now
Ranch-style corner lot home with finished basement and 5 bedroom and 3 full bathrooms. Living room has vaulted ceilings and a gas fire place. Kitchen boasts quartz countertops, stainless steel appliances, and new laminate flooring. Master bedroom on ...

$375,000
$375,000
Available: Right Now
Charming Bungalow in the Heart of Old Town Wellington, close to park and restaurant, Tastefully remodeled with new eat in kitchen with plenty of counter and cabinet space, new flooring, front porch and back deck. Main level bath and bedroom with addi...
$489,500
$489,500
Available: Right Now
New range/oven, updated landscaping in front and back!!! This delightful 3-bed, 2-bath home sits on a large.27-acre lot in the View Pointe Subdivision! With a cozy fireplace, vaulted ceilings, and an open floor plan, it's perfect for both relaxation ...
Wellington
According to statistics, the population in Wellington, CO amounts to 7,941, which shows growth 7% compared to the previous year. The median age of the city’s residents is 32. The average household income is $86,190, shifting growth 9% from the past year, and the average property value in Wellington, CO growth 5% to $238,300 throughout the year.
What is the Average Price of Apartments for Sale in Wellington, CO, 80549?
| Month | Median Price |
|---|---|
| Jun 2024 |
$486,009
|
| May 2024 |
$445,701
|
| Apr 2024 |
$432,449
|
| Mar 2024 |
$432,449
|
| Feb 2024 |
$432,449
|
| Jan 2024 |
$432,449
|
| Month | Median Price |
|---|---|
| Jun 2024 |
$424,406
|
| May 2024 |
$483,543
|
| Apr 2024 |
$453,238
|
| Mar 2024 |
$453,238
|
| Feb 2024 |
$453,238
|
| Jan 2024 |
$453,238
|
Household Income
The average household income in Wellington, CO grew from $79,411 to $86,190 in the past year. This data is an estimate based upon 2,684 households in Wellington, CO . The chart below presents how household income is distributed in Wellington, CO in comparison to the revenue allocation amid households nationally.
Property Value
According to data from last year, the average property value in Wellington, CO shifted from $226,300 to $238,300 throughout the year. The subsequent graph indicates the share of properties in the given price range in Wellington, CO in comparison to the median property value in the same price segment across the country. According to the data, the greatest share of Wellington, CO properties falls in the '$200,000 to $249,999' range, which is lower than the most significant median property across the country.
Property Taxes
One of the most important aspects for property owners is the amount of property taxes. This graph shows distribution of property taxes in Wellington, CO compared to median property taxes around the country. The prevalent amount of property taxes in Wellington, CO equals $1750, which is less than the national average.