Cherryland, CA, USA apartments for rent
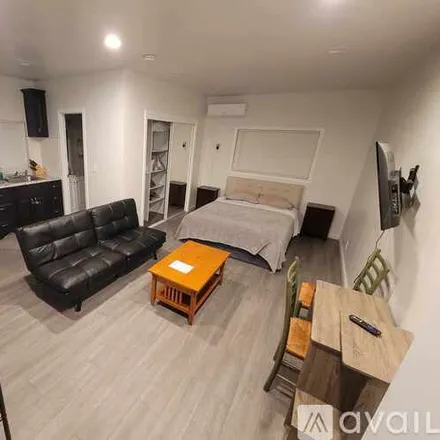
$1,900
Available: 01/07/2024
Listed: 09/05/2024
21366 Mission Boulevard
New studio built in2021, 1-year lease starting 7/1/24,$1,900 deposit, $1,900/mo rent, utilities separate. 2 occupants (recommended), required proof of income of at least 2.5x monthly rent. Last month rent (paid in advance) and deposit due at sign...
$850
Available: Right Now
Listed: 05/05/2024
421;423 B Street, Hayward, CA 94541, USA
Say hello to this beautiful and stylish 9 bed, 6 bath Hayward home! The updated interior boasts hardwood floors, lots of space, tall ceilings, and several windows throughout for prime natural light. Like to cook? The stainless steel appliances (dishw...
$2,200
Available: Right Now
Listed: 07/05/2024
716;736 Medford Avenue, Cherryland, Alameda County, CA 94541, USA
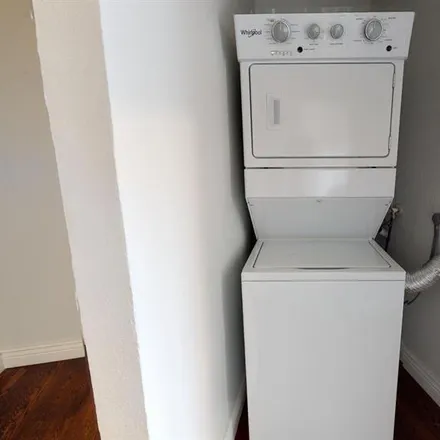
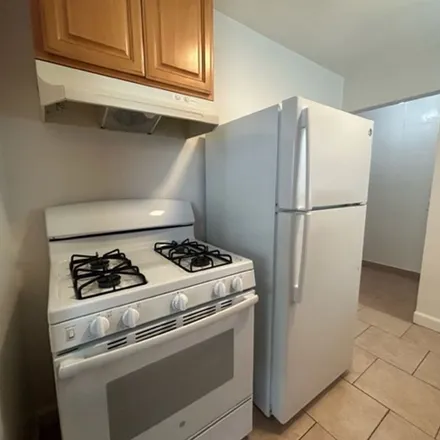
Welcome to the charming and inviting Cute & Cozy 1 Bd/1Ba. duplex on Medford Ave in Hayward, CA. This lovely home features a modern kitchen with granite countertops and a gas stove, perfect for preparing delicious meals. The laminated wood flooring a...
$2,500
Available: Right Now
Listed: 07/05/2024
21747 Vallejo Street
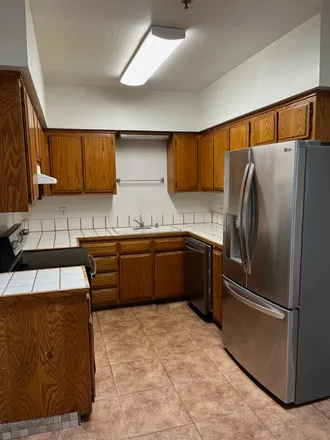
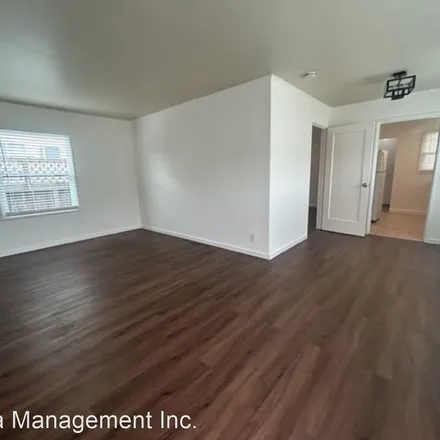
This spacious 2 Bedroom, 1 Bath Duplex apartment has tile flooringin the living areas and carpeting in one bedroom. There is a privatepatio and lots of off-street parking. Located in a quiet residential areawith easy access to freeways....
$2,222
Available: Right Now
Listed: 23/04/2024
716;736 Medford Avenue, Cherryland, Alameda County, CA 94541, USA
Cute & cozy 1 Bd/1Ba. duplex on Medford Ave. – Welcome to the charming and inviting Cute & Cozy 1 Bd/1Ba. duplex on Medford Ave in Hayward, CA. This lovely home features a modern kitchen with granite countertops and a gas stove, perfect for preparing...

$597
Available: Right Now
Listed: 01/04/2024
323 Smalley Avenue, Hayward, CA 94541, USA
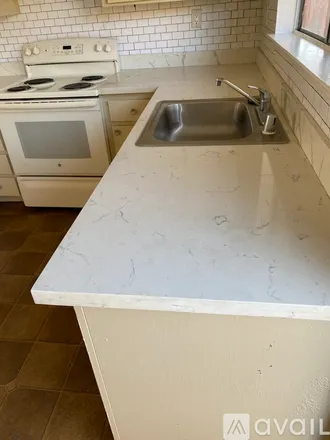
This unit is perfect for a small business warehouse or for housing your collector car. This unit comes with a full bathroom attached in the back....
$2,300
Available: 16/03/2024
Listed: 05/04/2024
19034 Lowell Avenue, Unit 3
Charming Two Bedrooms One Bath Townhome For Rent19034 Lowell Ave HaywardRemodeled2 BD, 1BAfor rent. Kitchen with electric appliancesGranite kitchen countertopPrivate back yardLaminated wood flooring in living ro...
$2,650
Available: Right Now
Listed: 09/04/2024
21214 Montgomery Ave.
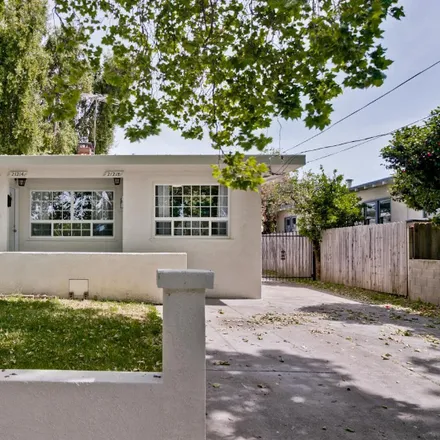
2 bedroom, 1 bath available4 people maximum. No pets. Open floor plan.1 parking spot available in the driveway and street parking available. Washer and dryer provided.Shared front yard, separated backyard, shed for storage in back...
Cherryland
Cherryland, CA has a population of 15,999, while the median age is 35. The household income in Cherryland, CA is around $58,631. The homeownership rate among the residents is 33%. The median residential property value in Cherryland, CA that you should keep in mind is $364,100.
| Population | 15,999 |
| Median Age | 34.8 |
| Poverty Rate | 23% |
| Household Income | $58,631 |
| Number Of Employees | 7,092 |
| Median Property Value | $364,100 |