Milpitas, CA 95035, USA apartments for rent

$4,500
$4,500
Available: Right Now
Modern2023 ADUtwo bedroom, two bath, fully furnished. Beautiful white modern kitchen with island and quartz counter tops. Plenty of kitchen cabinets for storage. All new stainless steel appliances which include, stove, oven, microwave, refrigerat...

$14,550
$14,550
Available: Right Now
This 4-Bedroom House offers everything you need for professionals seeking a short stay for job traveling and local visiting. Home's equipped with a full kitchen and 2 full bathrooms.Situated in the South Bay, it's super close to major tech compan...

$4,299
$4,299
Available: 21/07/2024
Significantly updated from the ground up -- This stunning 4-bedroom home offers tons of natural light and high-quality finishes throughout with new hardwood flooring, French windows, barn doors and a cozy backyard! You will appreciate the attention t...

$1,200
$1,200
Available: Right Now
3 Rooms available this summer! Looking for working professionals, must be clean and respectful! (References preferred but not required)bdrm with shared bathroom. Located in 2nd floor. Closet with large full length mirrors and ceiling light.</...

$4,300
$4,300
Available: Right Now
Newly remodeled with solid Quartz Countertop and cabinets, Hardwood floors throughout, Granite tile floor in kitchen and bathrooms. Dual pane windows. Newly painted interiors. Top Piedmont Schools. Easy access to 680 and 101 freeway, near major shopp...

$4,570
$4,570
Available: 15/08/2024
292 Sunflower Lane-3 Bedroom 2 Full & 2 Half Bathroom House In Milpitas With Great In-Home Amenities!3Bedroom, 2Full/2Half BTH Townhome with 2 Car Garage & EV Plug in outlet. Water Included, Loaded with GE appliances: Double door Fridge and pull-...

$5,340
$5,340
Available: Right Now
Wonderful home in the heart of Silicon Valley, perfect for professionals with easy access to Tech companies in the area.The home features 3 cozy bedrooms, 2 bathrooms, a spacious living room and kitchen, and backyard space.Just minutes from g...
$18,330
$18,330
Available: Right Now
Welcome to you're home away from home in the heart of Silicon Valley! Start your day off right with the complimentary breakfast buffet or take a dip in the pool. Let the free weekday shuttle take you where you need to go within a 5 mile radius of you...

$4,500
$4,500
Available: Right Now
This 4 bedroom, 2.5 bath home comes with peace, quiet, and numerous amenities! Walk through your front door, and you are greeted by beautiful tile and hardwood floors, leading into a spacious family room - complete with fireplace and bay window. Stro...
$5,100
$5,100
Available: Right Now
Feel at home wherever you choose to live with Blueground. You’ll love this comfortable Milpitas furnished one bedroom apartment with its modern decor, fully equipped kitchen, and roomy living room . Ideally located, you’re close to all the best that ...

$7,080
$7,080
Available: Right Now
This unique place has a style all its own. Less than 2 min walk to Great Mall (premier shopping mall with 225 stores) Entire apt features a private balcony/patio, air conditioning, closets, microwave, washer/dryer, free high speed internet. Our commu...

$4,610
$4,610
Available: 05/07/2022
Amazing Location!3Bedroom, 2Full/2Half BTH Townhome All White cabinets 2 Car Garage with EV Plug-in outletWater IncludedLoaded with GE appliances: Double door Fridge and pull-out freezer, Dishwasher touch s...

$4,500
$4,500
Available: Right Now
Charming Home for Rent in Milpitas. A beautifully maintained home ready for its next residents. This turn-key residence offers a spacious, open floor plan with high ceilings and abundant natural light throughout. Vaulted ceilings enhance the sense of...

$4,740
$4,740
Available: Right Now
One bedroom in a residential home with contemporary design, state-of-the-art amenities and modern yet comfortable located in the heart of Silicon Valley - the high-tech computer industry area. Our guests will enjoy a vibrant new community convenientl...
$5,910
$5,910
Available: Right Now
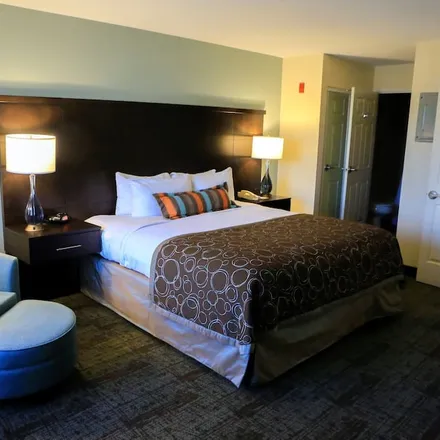
This modern hotel offers guest rooms with a flat-screen TV and coffee maker. Guests may take a refreshing dip in the outdoor pool or relax in the hot tub. The fitness center is well-equipped with cardio, weight machines, and yoga mats for daily worko...

$4,507
$4,507
Available: 15/08/2023
306 Sunflower Lane Amazing Mountain View! Private Walk path!This is a 3-bedroom, 2.5-bath house in Milpitas. Amenities include a balcony, central air, central heat, dishwasher, hardwood floors, stainless steel appliances, updated kitchen and bath...

$8,730
$8,730
Available: Right Now
This modern hotel offers guest rooms with a flat-screen TV and coffee maker. Guests may take a refreshing dip in the outdoor pool or relax in the hot tub. The fitness center is well-equipped with cardio, weight machines, and yoga mats for daily worko...

$4,000
$4,000
Available: 01/08/2024
Beautiful single family house, Three Bedrooms & Two BathroomsUpdated kitchen & bathroomsNew recessed lights in the living room , Family room and KitchenDual-pane windows throughout the houseNew Outdoor stucco New Roof New Plum...

$6,300
$6,300
Available: Right Now
This modern hotel offers guest rooms with a flat-screen TV and coffee maker. Guests may take a refreshing dip in the outdoor pool or relax in the hot tub. The fitness center is well-equipped with cardio, weight machines, and yoga mats for daily worko...
$7,110
$7,110
Available: Right Now
This modern hotel offers guest rooms with a flat-screen TV and coffee maker. Guests may take a refreshing dip in the outdoor pool or relax in the hot tub. The fitness center is well-equipped with cardio, weight machines, and yoga mats for daily worko...

$21,930
$21,930
Available: Right Now
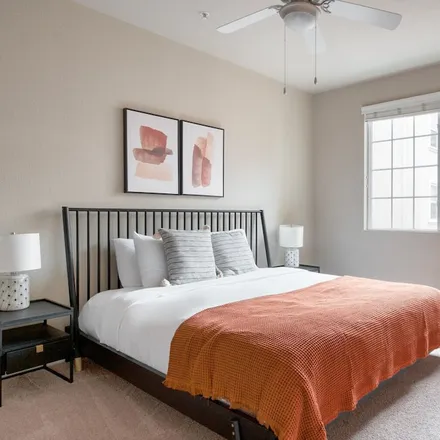
This hotel offers guest rooms with crisp white linens, cable TV, a seating area and a desk. Guests can enjoy a refreshing swim in the heated outdoor pool, work out in the well-equipped fitness center, and stay connected with the complimentary high-sp...
$7,680
$7,680
Available: Right Now
This hotel offers guest rooms with crisp white linens, cable TV, a seating area and a desk. Guests can enjoy a refreshing swim in the heated outdoor pool, work out in the well-equipped fitness center, and stay connected with the complimentary high-sp...
Milpitas
Milpitas, CA has a population of 75,498, while the median age is 37. The household income in Milpitas, CA is around $110,752. The homeownership rate among the residents is 64%. The median residential property value in Milpitas, CA that you should keep in mind is $704,300.