Oakley, CA 94561, USA apartments for rent

$3,100
$3,100
Available: 01/08/2024
Welcome to 318 Brookview Dr, where comfort and convenience meet in this cozy 3 bedroom, 2.5 bathroom house located in beautiful Oakley, CA. This spacious 1374-square-feet home offers everything you need for comfortable living. The property boasts h...
$4,595
$4,595
Available: Right Now
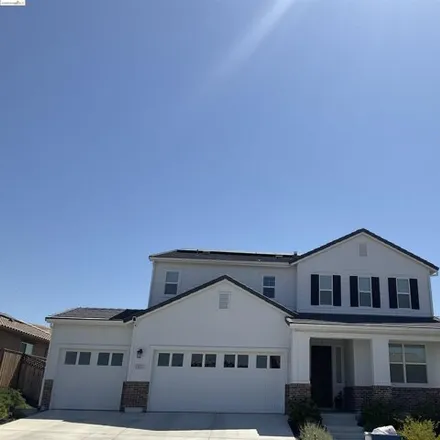
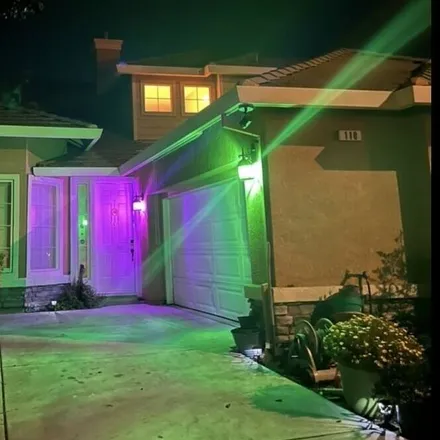
Beautiful 5-bedroom, 4-bath two story house with gorgeous views and backyard space with child structure and water feature. Attached 3-car garage . house is not furnished. no Pets. NO Evictions. 2.5X income needed. $50 application fee per adult...

$3,850
$3,850
Available: Right Now
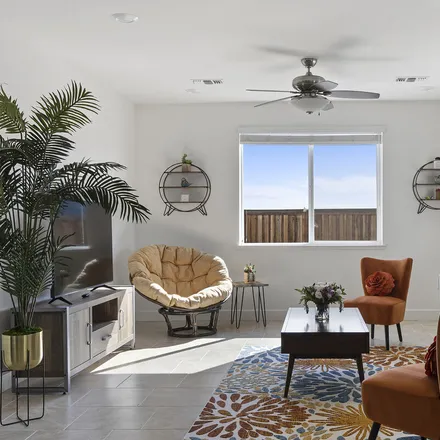
Welcome to your beautiful oasis! This 4-bed, 3-full bath home is now available for rent, within walking distance to Almond Grove Elementary and Freedom High School. Spacious kitchen featuring island, walk in pantry, and ample cabinets. Formal dining ...

$2,900
$2,900
Available: Right Now
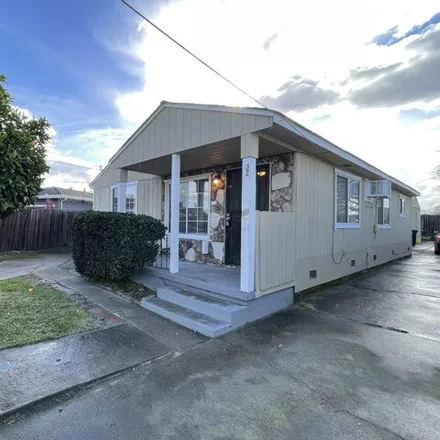
Great single story in Oakley. Lots of upgrades and remodeled. Kitchen totally remodeled. Granite counter tops, brand new appliances. New Stainless steel sink and faucet. All Carpeted rooms have brand new carpets. Both bathrooms have been remodeled an...

$6,000
$6,000
Available: Right Now
VRBO is the only website on which we are listed. Should you find us listed on any other platform outside of VRBO please know that it is fraudulent. Do not use Craig's List.Charming little house with view of the water. We have a large deck off the...

$14,130
$14,130
Available: Right Now
Enjoy a luxury experience at our relaxing, centrally-located home! Spacious 4 bedroom home with stylish loft perfect for families and friendsQuick drive to San Francisco, Napa Valley, and SacramentoFeatures an outdoor paradi...
$1,300
$1,300
Available: Right Now
My husband and I share a beautiful waterfront home in a new boating community. Our home is located in an unincorporated city called Bethel Island. The lovely island is centrally located with easy access to San Francisco, Napa, Dublin, San Ramon and O...
$2,590
$2,590
Available: Right Now
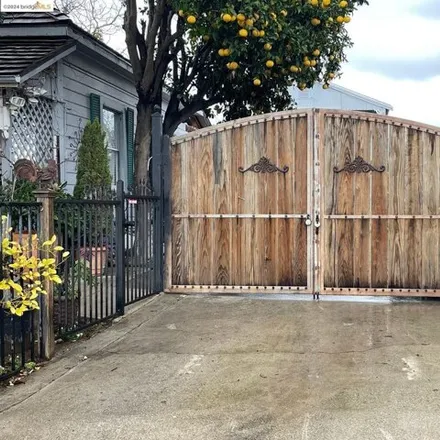
Beautiful Remodeled 2 Bedroom Home in the City Oakley. Home has been redone and has 2 bedrooms, with a nicely done bathroom and kitchen with wonderful countertops and new appliances, stove, oven, refrigerator, including a new washer, dryer, heating a...

$4,000
$4,000
Available: Right Now
New home built 2024 with over $100k upgrades, 5BR/4BA/2973sf, Master Suite has separate walk-in closet for his and her, Queen Suite and Guest Suite downstairs. Beautiful hardwood on the 1st floor and upgraded carpet on the 2nd. Three car garage parki...

$12,600
$12,600
Available: Right Now
Escape from the noise and traffic! The California Delta is elusive and unknown to many. Are you looking for peace and quiet? Or perhaps the family friendly splash fest? You want to take your boat and go tubing? explore the sloughs? go fishing? visit ...

$8,250
$8,250
Available: Right Now
An outdoorsman's paradise awaits at this unique 2-bedroom, 2-bath vacation rental on Bethel Island. Just outside your door, explore over 1,200 miles of waterways, including secluded beaches, fishing coves, and marinas, along with beloved past times l...
$6,500
$6,500
Available: Right Now
Bethel Island/Contra Costa County beautiful 4 bedroom 4 1/2 newer home on Delta Coves lagoon. Fully furnished and ready for move-in. Living room, dining area, gourmet kitchen, media room, office space. Laundry washer/dryer both upstairs and downstair...

$4,500
$4,500
Available: Right Now
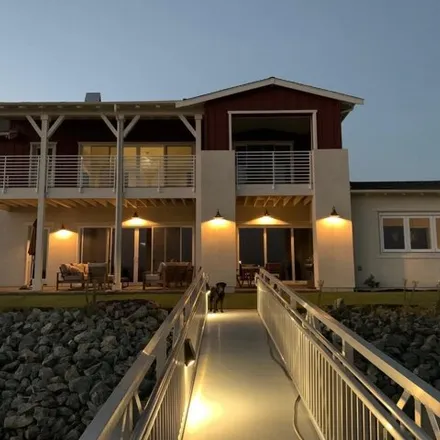
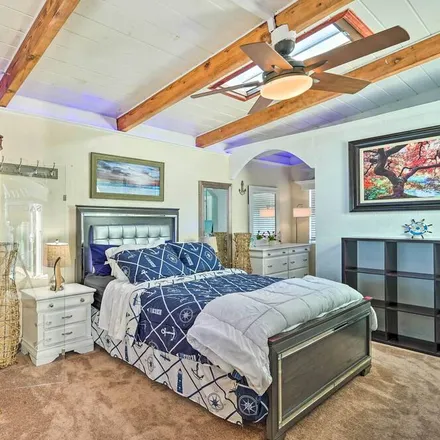
This perfect vacation home is fully equipped to be your home-away-from-home. First, there are stunning water-front views, and a vacation-ready layout for up to 6 guests. Opting for clean and uncluttered energy. You'll find this property is equipped f...

$4,470
$4,470
Available: Right Now
Newly fully remodeled cottage on 1/4 acre. Fenced in yard. 40" flat screen TV with local channels and large DVD library, pool table, table & yard activities. Family friendly. All new appliances, kitchen, bedding, etc. Family safe for small children w...
$3,342
$3,342
Available: Right Now
Wonderful Oakley Home in a Court. 3 bedroom 2 bath home, with a open kitchen and family room. Home has been updated with new flooring, paint and many other things. Backyard has fresh fruit trees and a private back yard. Home is within walking distanc...
$3,750
$3,750
Available: Right Now
My late mother’s house was built in 2004, it’s 2,492 sq. ft., 8,269sqft. lot, 5 bedrooms, 3.5 baths so you’ll have plenty of room for your belongings incl. luggage. On the first floor: living room, kitchen, dining area and laundry room. Additionally ...

$6,630
$6,630
Available: Right Now
Ideal in all seasons, this 2-bedroom, 2-bath waterfront retreat offers effortless access to fishing, boating, kayaking, and wildlife viewing on Bethel Island. Choose to kick back and relax, look for otters and sea lions off the coast, or spend the af...

$6,900
$6,900
Available: Right Now
Peace at the RiverOur calendar is updated in real-time & our nightly rates are accurately displayed. Simply enter your desired dates and click 'Book Now!'Experience a peaceful and entertaining stay when you book this charming home with a rive...
$7,020
$7,020
Available: Right Now
With the shoreline steps away and countless water sports activities at your fingertips, you may never want to leave this 1-bedroom, 2-bathroom vacation rental! Fully equipped with kayaks, paddleboards, fishing equipment, and a water slide, this stunn...

$12,000
$12,000
Available: Right Now
Growing up on the Delta, there isn't a single childhood and young adult memory that doesn't include a warm summer, golden hour float on the river. Whatever the season, this home is a haven on the water. It boasts two homes; a three bedroom/ two bath ...

$6,930
$6,930
Available: Right Now
Stunning Lake view Delaney Park Solar home close to Marina to enjoy boating, fishing and kayaking. Great convenient location to Highway4, BART & other transportation options. Two year old almost new single family Executive-style 4 bedroom with Loft, ...

$1,104
$1,104
Available: Right Now
Available furnished or unfurnished Large, comfortable home with 5 great roommates/tenants. No drama! Home has 2 males and 3 females. Street parking. Quiet neighborhood. Month to month but long term preferred....
Oakley
Oakley, CA has a population of 39,950, while the median age is 34. The household income in Oakley, CA is around $89,392. The homeownership rate among the residents is 75%. The median residential property value in Oakley, CA that you should keep in mind is $356,000.