Riverbank, CA, USA apartments for rent
$3,100
$3,100
Available: 10/07/2024
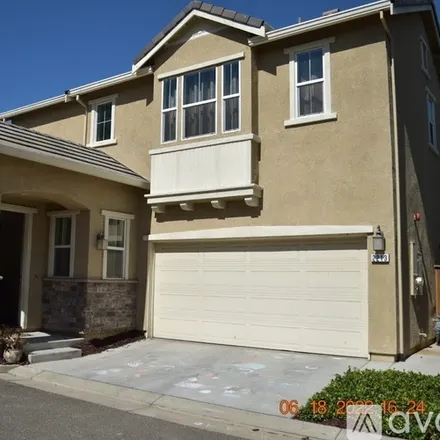
Recently built 5 bedroom, 3 full bath (4 bedroom with additional office or extra bedroom) home in great, safe neighborhood. Master bedroom with private luxury bath suite.Additional interconnected bathroom with private access for the other bed...

$4,260
$4,260
Available: Right Now
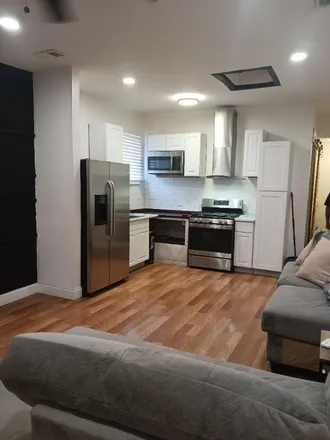
Embark on a sunny Riverbank adventure with a stay at this 1-bathroom studio. With a well-equipped kitchen and all the essentials for a comfortable stay, this cozy escape is perfect for solo excursions or a couple's trip. Explore nearby attractions ar...
$1,000
$1,000
Available: Right Now
Charming 2 bed, 1 bath single family home in Saint Louis! This cozy property on 3834 Texas Ave features a fenced yard, off-street parking, and is pet-friendly for small dogs. Enjoy amenities like a microwave, oven, and washer/dryer hookups. Don't mis...

$11,010
$11,010
Available: Right Now
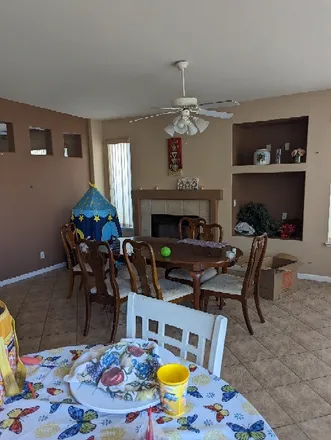
Explore California's Central Valley in style when you stay at this 4-bedroom, 2.5-bathroom vacation rental! Spend your days kayaking and fishing along the scenic Stanislaus River, taking a day trip to exciting Modesto, or visiting the charming town o...

$9,210
$9,210
Available: Right Now
Experience a trip to Riverbank, CA, with a stay at this spacious 4-bedroom, 2.5-bath vacation rental! Located near Modesto attractions, like the Modesto Arch and Tuolumne River Regional Park, this property offers a comfortable and convenient home bas...

$793
$793
Available: Right Now
We are a new couple with children. We have an extra room for rent. I know how expensive it is to rent and without good credit and 3 times the rent now days is a hassle. We don't check credit....
$850
$850
Available: Right Now
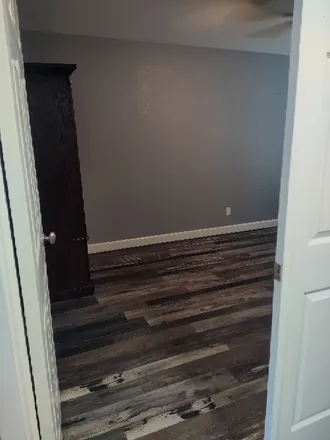
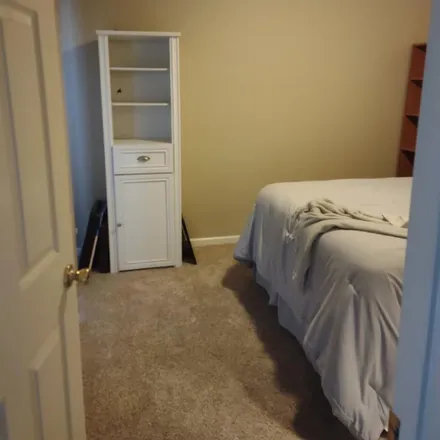
This room is a large room. It used to be a second living room that was converted to a bedroom. The...

$3,100
$3,100
Available: Right Now
Recently built 5 bedroom, 3 full bath (4 bedroom with additional office or extra bedroom) home in great, safe neighborhood. Master bedroom with private luxury bath suite.Additional interconnected bathroom with private access for the other bed...
$800
$800
Available: Right Now
Hi I have two rooms coming about May 1st.The rooms are a piece. Plus your portion of the bills.There will be a shared bathroom, the rooms come with 1 garage space a piece.. there is also a storage in back. This arrangement is for roommates so...
$950
$950
Available: Right Now
Bedroom located downstairs next to kitchen. Has its own bathroom. Great neighborhood. Pool. Spa please no pets....
Riverbank
Riverbank, CA has a population of 24,047, while the median age is 32. The household income in Riverbank, CA is around $63,656. The homeownership rate among the residents is 68%. The median residential property value in Riverbank, CA that you should keep in mind is $247,200.
| Population | 24,047 |
| Median Age | 32.2 |
| Poverty Rate | 11% |
| Household Income | $63,656 |
| Number Of Employees | 10,841 |
| Median Property Value | $247,200 |