Alexandria, LA, USA apartments for sale
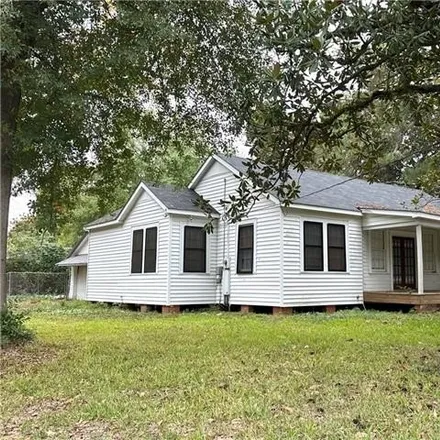
$99,000
$99,000
Available: Right Now
This charming home offers three bedrooms and one bathroom, providing ample space for a family or as an investment property. With its fenced-in backyard, the property offers a space for outdoor activities and gatherings.The roof was recently replaced ...

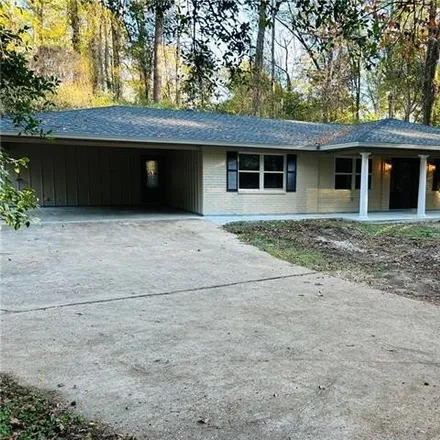
$147,000
$147,000
Available: Right Now
Stop....wait...don ' T rent any longer !!! This Renovated 3 Bedroom 1 bath home was gutted and remodeled in 2022. This home features a beautiful modern renovated kitchen with gas range and oven, bathroom with new fixtures, laminate wood...
$276,000
$276,000
Available: Right Now
Welcome home to this completely remodeled 4-bedroom 2-bathroom, conveniently located in the heart of Pineville. The eat-in kitchen has Whirlpool stainless steel appliances, farmhouse sink, beautiful granite countertops, and a huge walk-in pantry. The...
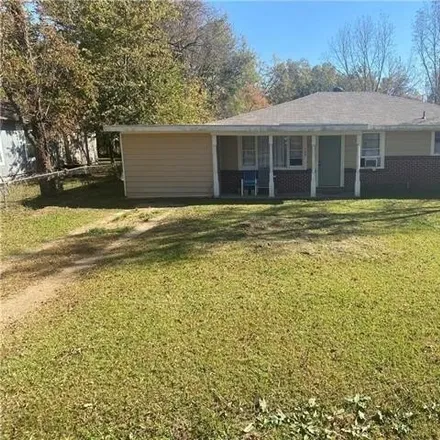
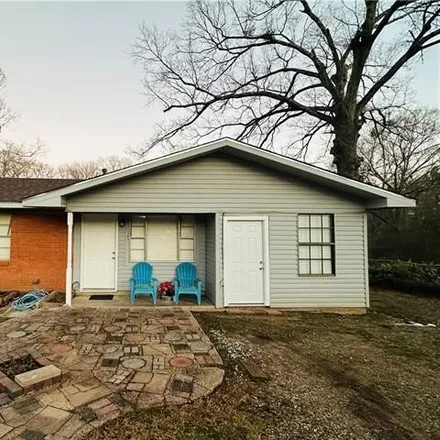
$95,000
$95,000
Available: Right Now
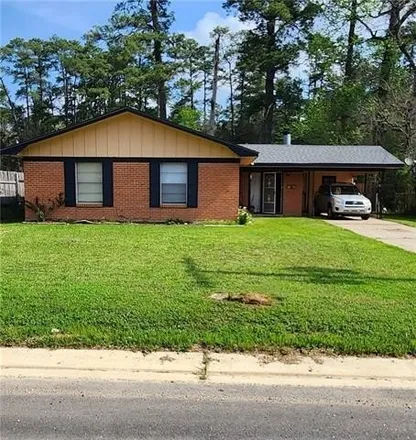
This newly remodeled 3 bedroom 1 bath home is perfect for a starter home or investment property. With recent updates including an approximately 2 year old roof, new flooring, fresh paint, updated light fixtures, and new countertops, this home offers ...
$235,000
$235,000
Available: Right Now
Come and get it ! Move in ready !!! This completely remodeled brick, corner lot home in a well established neighborhood includes :4 bedrooms 2 and a half baths, a huge living area, a large fenced backyard with a deck and plenty of pa...
$119,500
$119,500
Available: Right Now
Conveniently located in a quiet area of Pineville sits this charming 3 bdrm. 1 1/2bthrm. home waiting for it's new owner! Just a stones throw from Louisiana College and Military Hwy is this gem that offers a great fenced in back yard, a shop that is ...
$279,000
$279,000
Available: Right Now
4009 Mayflower Boulevard is a stunning home on a boulevard in a well established neighborhood in Alexandria. This property has three bedrooms and two and one half baths. Large rooms and an open concept dominate this beauty, PLUS it has an extra room ...

$110,000
$110,000
Available: Right Now
Multifamily investment property comprising the corner of South Street and Odom Street consisting of a triplex-1020 South Street is 1 bedroom/1bath currently rented for$500. 1229 BOdom is a downstairs unit 1 bedroom/1 bath currently rented for$550. 12...
$130,000
$130,000
Available: Right Now
2 bedroom 1 bathroom home in Alexandria, just minutes from Cabrini Hospital. Original hardwood floors throughout, formal dining room, and floor to ceiling windows that let in the most beautiful filtered light through the surrounding oak trees. Step o...

$235,000
$235,000
Available: Right Now
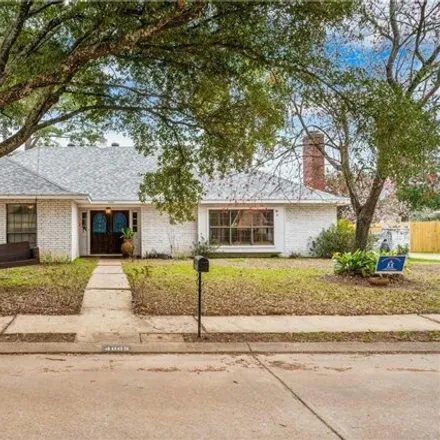
Looking for housing in an established and charming neighborhood. there ' S nothing for you to do but move into this 3 bed, the dining area could be a 4th bedroom, 2full bath home, updated throughout ! 30 year architect shingle roof w...
$125,000
$125,000
Available: Right Now
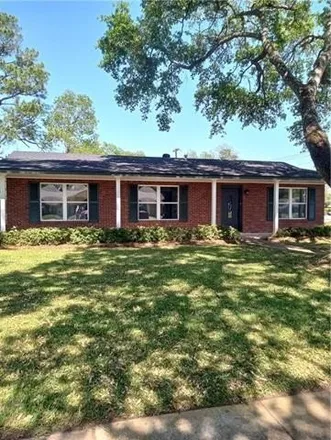
$97,000
$97,000
Available: Right Now
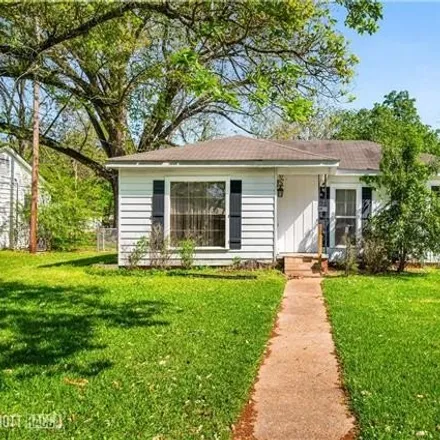
Back on the market at no fault of the seller . motivated seller !!!! Great starter home for first time buyer or investment property. This home is situated on a dead end road. Front porch is great for drinking coffee in the morning. There is al...
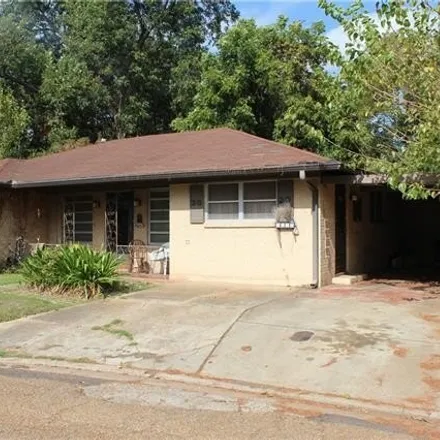
$79,500
$79,500
Available: Right Now
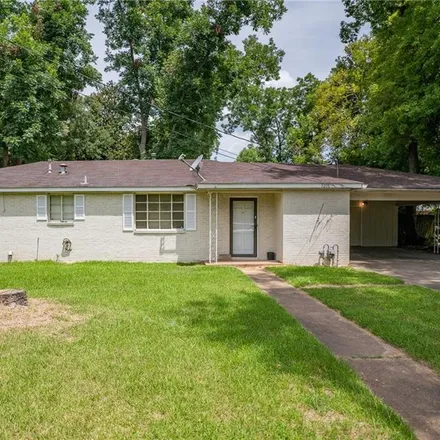
Looking for a great home in Garden district of Alexandria. This home is in very good repair and could be sold as a residential home or a great investment property. This 3 bedroom/ 2 bath home has wood and ceramic tile floors. Very little carpet and t...
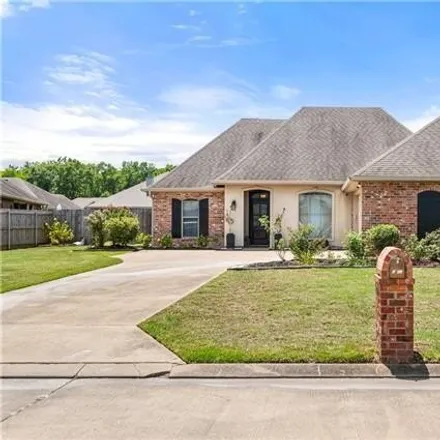
$280,000
$280,000
Available: Right Now
Presenting your next dream home in the sought after neighborhood of Bocage Subdivision in Alexandria, LA. This charming and well-maintained house boasts a comfortable and modern living space. The adorable kitchen has stainless steel appliances and a ...

$349,900
$349,900
Available: Right Now
$490,000
$490,000
Available: Right Now
This two story house have 5 bath/3.5 bed house in the gated community, it won't last long. The house is well maintain and move in ready. It located in scenic Bonaire Subdivision , corner lot home awaits its next owner. The house have a modern touch. ...
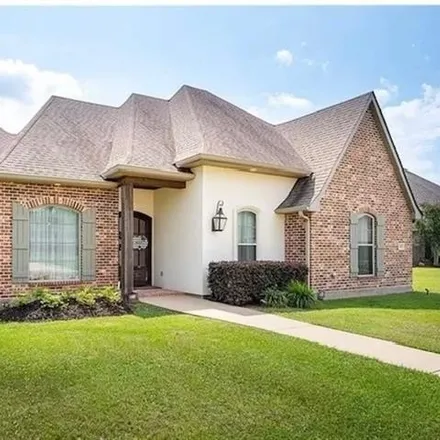
$415,000
$415,000
Available: Right Now
Don't Miss This One!! This Beautiful Well-Maintained home is located in one of Alexandria's most exquisite neighborhoods. It offers a Split Floor Plan, a Huge Master EnSuite with a Garden Soak Tub for Relaxing. 4 Bedrooms, 2.5 Bathrooms with a spacio...
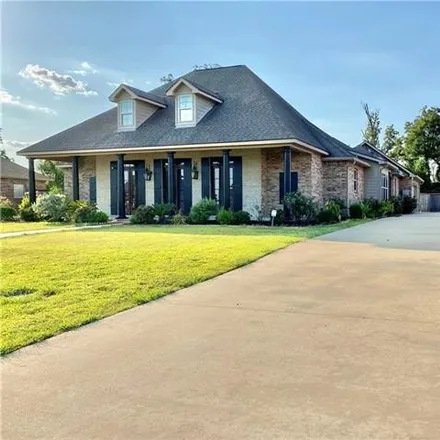
$449,949
$449,949
Available: Right Now
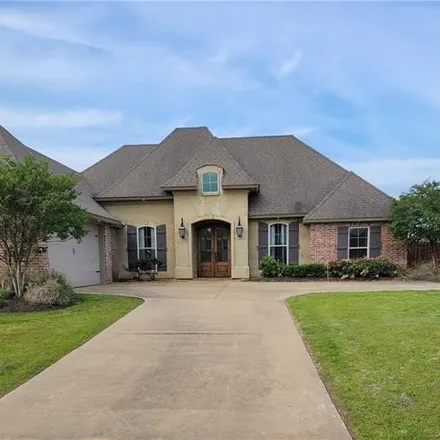
French -Country -Home in St. Andrews Links Estates. Features spacious open floor plan with 2 living areas, gleaming hardwood ceramic flooring, split bedrooms with private primary suite offering a most appealing bath with separate tile shower, double ...
$389,900
$389,900
Available: Right Now
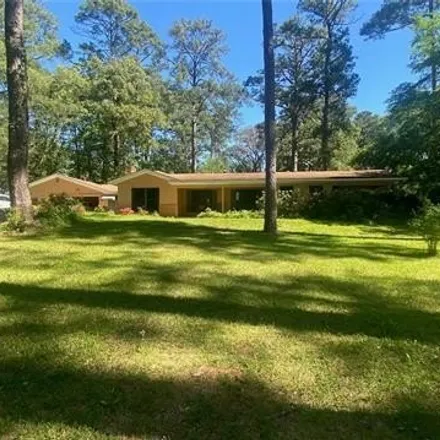
For those entertainers...for those needing large space for their growing or already grown family....let your sense of creativity go to work for you! This property is going to be for those who see it's value! You couldn't build half of this for this p...
$267,000
$267,000
Available: Right Now
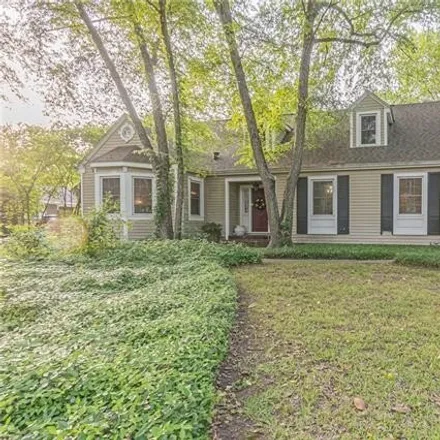
Welcome to 2816 Elliott Street, a captivating historical home nestled in the heart of Alexandria, Louisiana. Boasting 3 bedrooms, 3 bathrooms, and a library adorned with custom-built cabinets, this residence offers a blend of classic charm and modern...

$229,000
$229,000
Available: Right Now
Nestled in Cherokee's tranquil neighborhood on Navaho Trail, this recently renovated 3-bedroom, 2-bathroom house exudes modern comfort. Updates include a new hot water heater, central HVAC, flooring, roof, and a remote-controlled electric heater in t...
$249,500
$249,500
Available: Right Now
Come check out this home in Pineville school district and in walking distance of the junior high. If 3 bedrooms and 2 baths, formal dining, and living room is not enough space, then the spacious sunroom should be. Home is in well established neighbor...
Alexandria
According to statistics, the population in Alexandria, LA amounts to 47,954, which shows decline 0% compared to the previous year. The median age of the city’s residents is 39. The average household income is $36,997, shifting growth 3% from the past year, and the average property value in Alexandria, LA growth 2% to $137,900 throughout the year.
| Population | 47,954 |
| Median Age | 38.8 |
| Poverty Rate | 22% |
| Household Income | $36,997 |
| Number Of Employees | 19,004 |
| Median Property Value | $137,900 |
What is the Average Price of Apartments for Sale in Alexandria, LA?
| Month | Median Price |
|---|---|
| Apr 2024 |
$315,155
|
| Mar 2024 |
$315,155
|
| Feb 2024 |
$315,155
|
| Jan 2024 |
$315,155
|
| Dec 2023 |
$465,874
|
| Nov 2023 |
$335,974
|
| Month | Median Price |
|---|---|
| Apr 2024 |
$519,967
|
| Mar 2024 |
$782,914
|
| Feb 2024 |
$782,914
|
| Jan 2024 |
$782,914
|
| Dec 2023 |
$550,778
|
| Nov 2023 |
$355,563
|
Household Income
The average household income in Alexandria, LA grew from $35,931 to $36,997 in the past year. This data is an estimate based upon 17,983 households in Alexandria, LA . The chart below presents how household income is distributed in Alexandria, LA in comparison to the revenue allocation amid households nationally.
Property Value
According to data from last year, the average property value in Alexandria, LA shifted from $134,700 to $137,900 throughout the year. The subsequent graph indicates the share of properties in the given price range in Alexandria, LA in comparison to the median property value in the same price segment across the country. According to the data, the greatest share of Alexandria, LA properties falls in the '$150,000 to $174,999' range, which is lower than the most significant median property across the country.
Rent vs. Own
Property Taxes
One of the most important aspects for property owners is the amount of property taxes. This graph shows distribution of property taxes in Alexandria, LA compared to median property taxes around the country. The prevalent amount of property taxes in Alexandria, LA equals $800, which is less than the national average.