Annapolis, MD, USA apartments for sale

$650,000
$650,000
Available: Right Now
Located on a cul-de sac in the highly sought after neighborhood of Annapolis Roads, this 3 bedroom 2/1bathroom situated on a wooded lot is a must see. Upper level has an open floor plan with kitchen flowing into a cathedral ceiling great room. Bright...
$2,4M
$2,4M
Available: Right Now
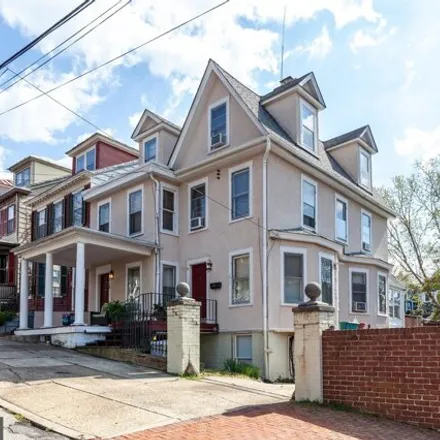
Situated in an ideal location in the heart of Historic Annapolis just steps away from Spa Creek. A stately duplex on quiet, lower Market Street with water views from the front porch and a driveway leading to five off street parking spots behind the r...
$999,990
$999,990
Available: Right Now
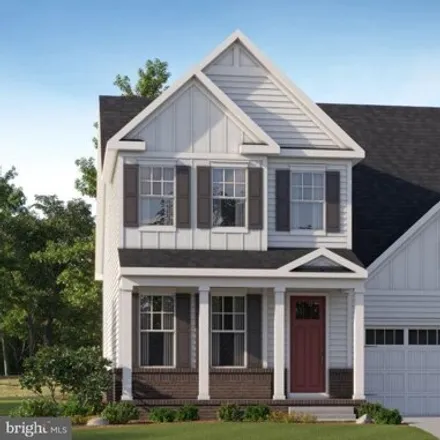
March Delivery! This brand-new home is the perfect match for all of your family's needs! This home offers 3 different levels of living space, with 3 bedrooms located on the third floor and 1 bedroom on the first. The home has 4.5 bathrooms, with 2 of...

$239,000
$239,000
Available: Right Now
Great starter home ready for new owners. Recently updated with new paint, appliances and more. Two bedrooms upstairs and partially finished basement. Start your investment here either building owner equity or easy to rent as an investor. Affordable l...
$679,000
$679,000
Available: Right Now
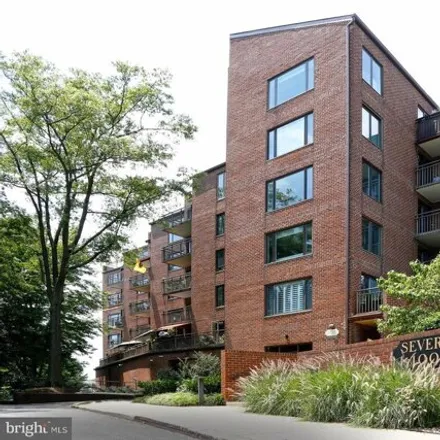
$679, 900.00Huge Price Reduction and Move In Ready with Parking!!! Coveted first floor parking in the garage. Additional guest parking located in Severn One Hundred parking lot. Public Open House This Sunday December 11th From Noon to One Amazing opp...
$249,600
$249,600
Available: Right Now
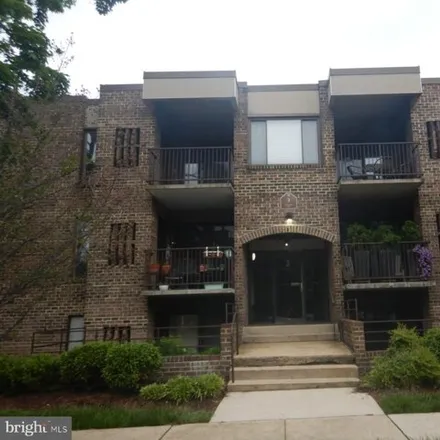
Welcome to the Fairwinds of Annapolis Community the best price and value anywhere near Annapolis. FHA approved. The location provides convenient commute to DC, Baltimore, Andrews Air Force Base, Fort Mead and the Naval Academy, The two bedroom two ba...
$1,8M
$1,8M
Available: Right Now
Location, location, location! Investor alert for an apartment unit building that can be converted to a single family home in historic Annapolis! This property is steps away from city dock and all that downtown Annapolis has to offer! Enjoy inc...

$875,000
$875,000
Available: Right Now
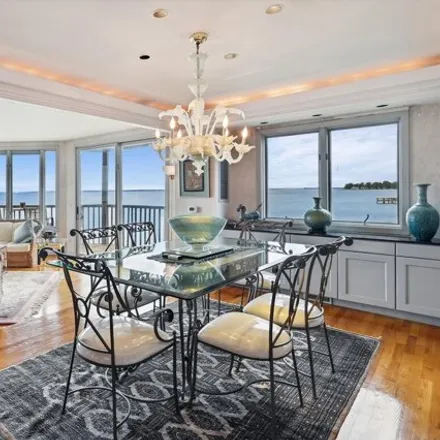
Welcome to this elegantly remodeled terrace-level condominium in the prestigious gated community of Chesapeake Harbour. This unique property is fully accessible with no steps and is positioned perfectly, boasting uninterrupted and sweeping views of t...

$3,95M
$3,95M
Available: Right Now
Coveted West Annapolis Waterfront property with deep water floating dock! Experience elegance and grace in this stunning 4 story home that is sure to captivate. The contemporary architecture and voluminous spaces mixed with traditional finishes and f...
$825,000
$825,000
Available: Right Now
Discover the allure of 303 Edgemere Drive, an exquisite south-facing cottage nestled in Annapolis's serene Hillsmere community. This is not just a home; it's an enclave of luxury, where over$200, 000in tasteful additions and updates create a space th...

$749,000
$749,000
Available: Right Now
Welcome to this move right in, first floor, 2 bed, 2 bath condo in Park Place. Freshly painted, new carpet and refrigerator. Discover the upscale lifestyle and numerous amenities that Park Place offers. Enjoy one of the few outdoor patios that comes ...
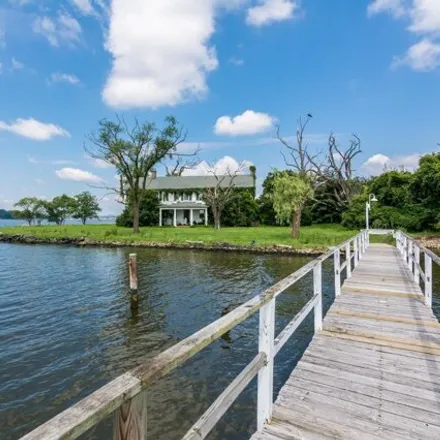
$2,7M
$2,7M
Available: Right Now
Magnificent views from this South River 1.15 acre waterfront property with 200' of frontage, Property offers existing home as well as second dwelling/ home and detached garage, Value is in the land as dwellings will need to be rebuilt, Current front ...

$359,000
$359,000
Available: Right Now
Subject to current lease Clean, beautiful, convenient.....this second floor home is perfect for living and entertaining! This fabulous unit is over 1100 square feet, and the very well designed floorplan allows for both the feeling of openness as well...
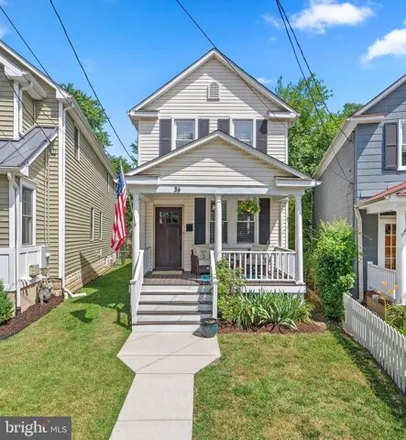
$879,900
$879,900
Available: Right Now
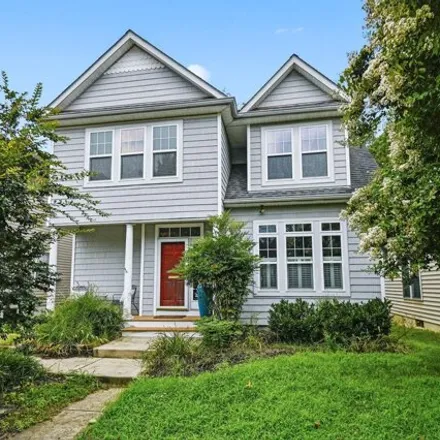
Welcome to your dream home in the highly sought-after Presidents Hill neighborhood of Annapolis! This stunning residence boasts three bedrooms, three and a half baths, and a charming front porch. Enjoy the spacious gourmet kitchen with stainless stee...
$1,4M
$1,4M
Available: Right Now
Open house: Saturday10:00AM - 2:00PMand Sunday10:00AM - 12:00PM.Meticulously maintained and conveniently located in the Heart of Eastport, this lovely home provides easy access to all that Eastport and Historic Annapolis has to offer (The Anna...
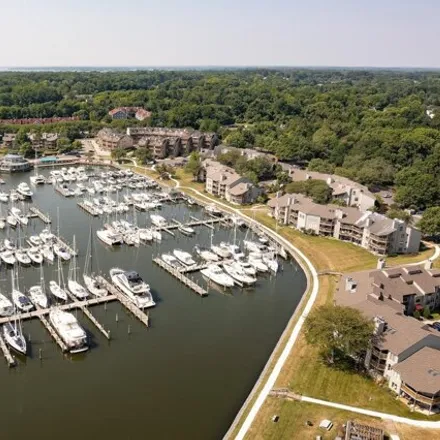
$575,000
$575,000
Available: Right Now
Lovely 2 bedroom 2 bath end unit overlooking the marina and onsite restaurant. Enjoy this attractive ground level condo with a large wrap-around patio located in luxury resort style community with a gated entrance and water views of the marina. An on...
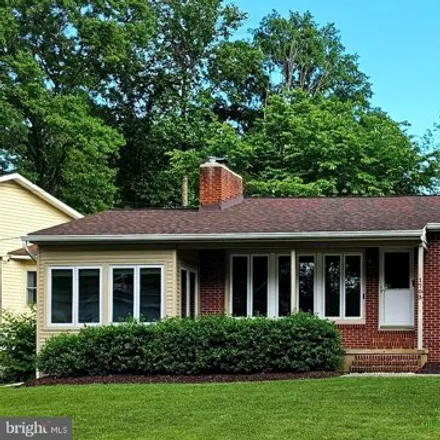
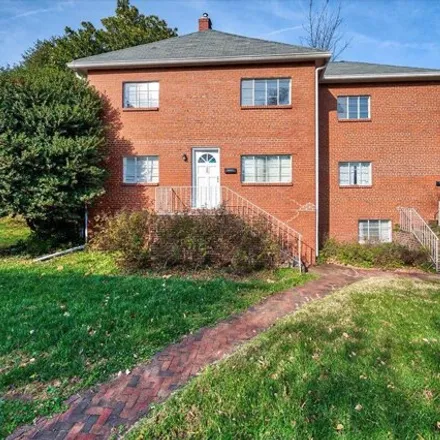
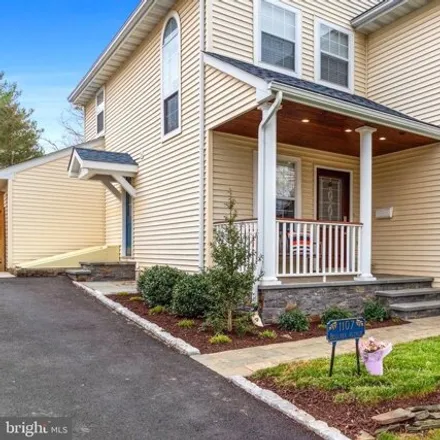
$650,000
$650,000
Available: Right Now
Lovely Brick Front Ranch Style Home in Prime Location just minutes from Downtown Annapolis in the Fabulous Admiral Heights Community. Offering an Updated Kitchen, Wood Floors on the Main Level, Gorgeous Stone Fireplace, Finished Sunroom, Primary Bedr...
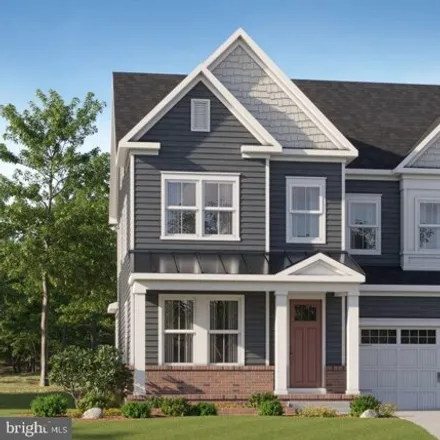
$1,13M
$1,13M
Available: Right Now
May Delivery! This brand-new home is the perfect match for all of your family's needs! This home offers 4 different levels of living space, with 4 bedrooms located on the second floor and 1 bedroom on the third. The home has 5.5 bathrooms, with 3 of ...
$2,4M
$2,4M
Available: Right Now
Breathtaking panoramic water views of the Chesapeake Bay from the Bay Bridge to off Thomas Point Light House from the 1st floor Family Room with full bath, the 2nd floor Living Room with fireplace, Formal Dining Room and Spacious eat-in Kitchen, and ...
$1,45M
$1,45M
Available: Right Now
Stunning Eastport Craftsman light filled home with 9 foot ceilings and open floor plan. Designed to easily add an elevator. Gourmet kitchen with black granite counters and breakfast bar, Stainless Steel appliances. Family room with gas fire place. En...

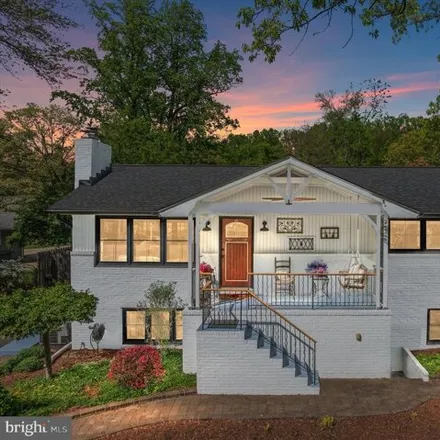
$699,999
$699,999
Available: Right Now
Welcome to your dream home! This beautifully updated split-level residence offers the perfect blend of modern amenities and serene natural surroundings. Boasting 4 spacious bedrooms and 3 luxurious baths, this home is designed for both comfort and st...
$290,000
$290,000
Available: Right Now
Welcome to this elegant 2-bedroom, 2 full bath garden condo that exudes sophistication and style, and located in the desired Spa Cove community in Annapolis. With new carpet and fresh interior paint throughout, this sunlit haven boasts a spacious ope...
Annapolis
According to statistics, the population in Annapolis, MD amounts to 39,151, which shows decline 0% compared to the previous year. The median age of the city’s residents is 37. The average household income is $81,143, shifting growth 9% from the past year, and the average property value in Annapolis, MD growth 5% to $395,900 throughout the year.
| Population | 39,151 |
| Median Age | 37.4 |
| Poverty Rate | 10% |
| Household Income | $81,143 |
| Number Of Employees | 21,492 |
| Median Property Value | $395,900 |
What is the Average Price of Apartments for Sale in Annapolis, MD?
| Month | Median Price |
|---|---|
| Jun 2024 |
$1,007,525
|
| May 2024 |
$740,824
|
| Apr 2024 |
$784,252
|
| Mar 2024 |
$784,252
|
| Feb 2024 |
$784,252
|
| Jan 2024 |
$784,252
|
| Month | Median Price |
|---|---|
| Jun 2024 |
$1,115,517
|
| May 2024 |
$890,289
|
| Apr 2024 |
$815,550
|
| Mar 2024 |
$815,550
|
| Feb 2024 |
$815,550
|
| Jan 2024 |
$815,550
|
Household Income
The average household income in Annapolis, MD grew from $74,187 to $81,143 in the past year. This data is an estimate based upon 15,684 households in Annapolis, MD . The chart below presents how household income is distributed in Annapolis, MD in comparison to the revenue allocation amid households nationally.
Property Value
According to data from last year, the average property value in Annapolis, MD shifted from $377,200 to $395,900 throughout the year. The subsequent graph indicates the share of properties in the given price range in Annapolis, MD in comparison to the median property value in the same price segment across the country. According to the data, the greatest share of Annapolis, MD properties falls in the '$500,000 to $749,999' range, which is higher than the most significant median property across the country.
Rent vs. Own
Property Taxes
One of the most important aspects for property owners is the amount of property taxes. This graph shows distribution of property taxes in Annapolis, MD compared to median property taxes around the country. The prevalent amount of property taxes in Annapolis, MD equals $3000, which is less than the national average.