Apple Valley, CA, USA apartments for sale
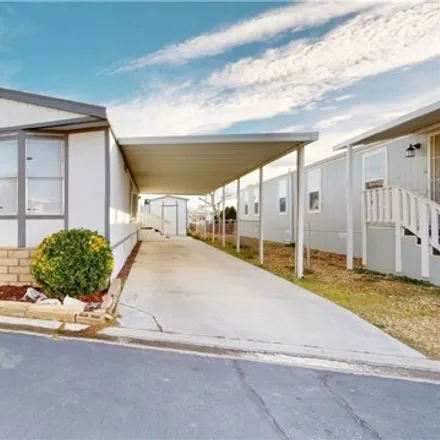
$94,900
$94,900
Available: Right Now
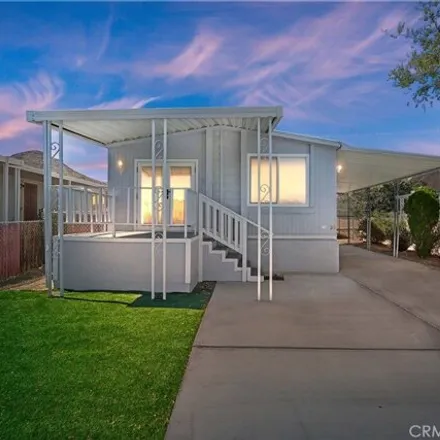
Welcome to your Oasis at Los Ranchos Mobile Home Park in Apple Valley, nestled within this easygoing community, you will find our beautiful 2-bedroom, 2-full bathroom single wide manufactured home built in 1985 features laminate flooring throughout, ...
$469,000
$469,000
Available: Right Now
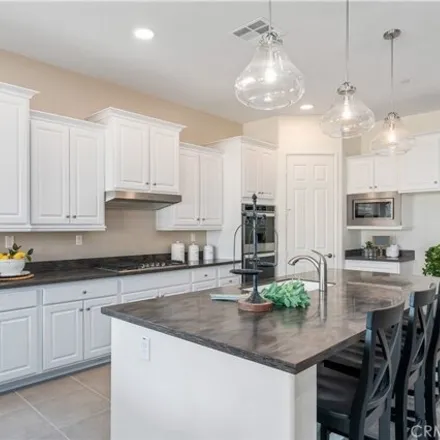
Prestigious Spring valley lake..... Custom Home on a Quiet Street ......all on one level.... Beautifully upgraded home......Gourmet Gas Kitchen....Granite Countertops.......Great Room with a cozy Fireplace......with 4 huge bedrooms..Thi...
$439,000
$439,000
Available: Right Now
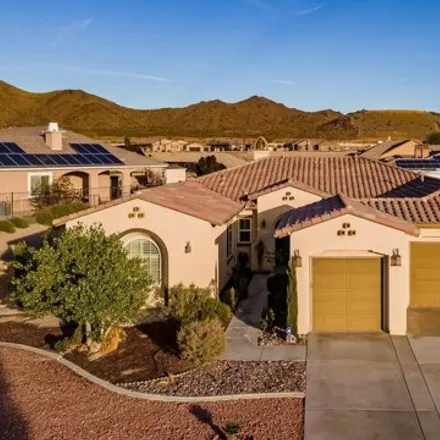
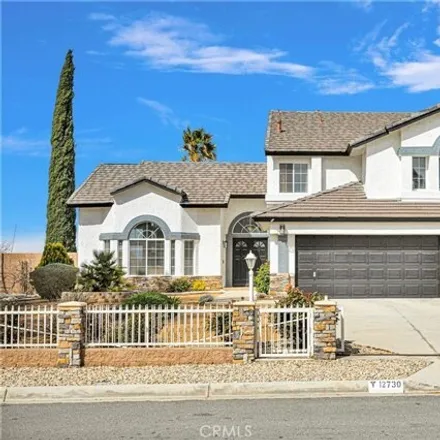
47 solar panels included free and clear !! Newer roof, large 1 acre lot, minutes to the 15 fwy, multiple large shopping centers around the corner. award winning school district. Welcome to your new home!! Comfortably sitting on a boasti...
$618,000
$618,000
Available: Right Now
Location-Location-Location! On The Water property in the prestigious Spring Valley Lake Community! This 4 bedroom, 3 bath home features a family room with a cozy fireplace that opens to the kitchen. The kitchen has been totally remodeled with quartz ...
$665,000
$665,000
Available: Right Now
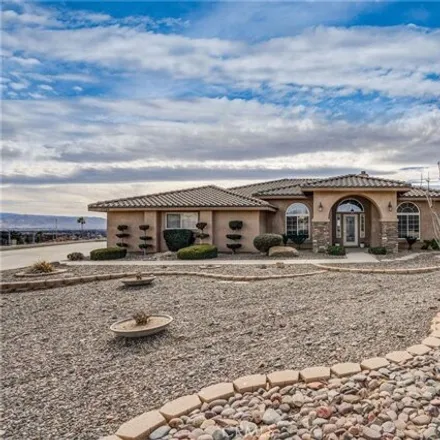
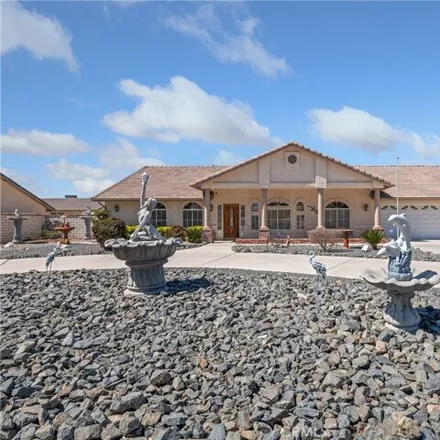
Beautiful executive home located in a gated community on a huge lot. This 4 bedroom and 4 bathroom single story home has all the upgrades including wood and tile floors, granite counters with custom backsplash, double doors in front, crown molding, w...
$775,000
$775,000
Available: Right Now
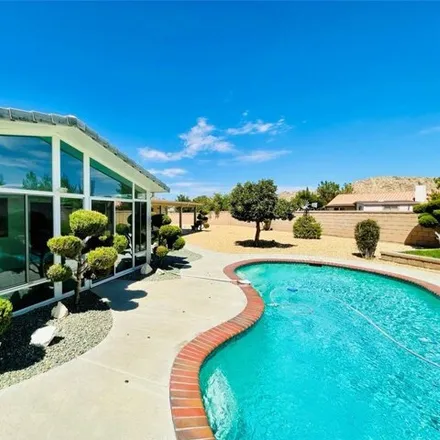
Back on the market at NO fault to the home ...location...location...location !! The possibilities are endless in this Huge pool home , entertainers delight ! With over4, 000sqft this home features 6 full bedrooms, PLUS office, 4 ...
$750,000
$750,000
Available: Right Now
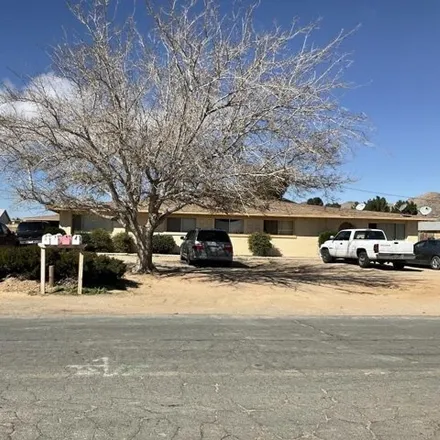
Fourplex. delivered with tenants in place. All units are individually metered for gas and electricity and have washer/dryer hookups in units. pays water (master meter) and trash. The 3 occupied units are currently grossing$3, 850/month ($46, 2...
$625,000
$625,000
Available: Right Now
Beautiful Spring Valley Lake Custom Home with gorgeous views of the valley and mountains. At the End of Cul-de-sac with stunning curb appeal. Home has new paint outside and new outdoor lighting. Walk into a luxurious 3 bedrooms and 3 full bath home. ...
$635,000
$635,000
Available: Right Now
Entertainer's delight! Welcome to the desirable Sterling Valley Ranch Community in Apple Valley where there are no HOA's! This home screams pride of ownership. Boasting a total of five bedrooms and three full bathrooms with a bed and bathroom conveni...
$679,900
$679,900
Available: Right Now
Indulge in the pinnacle of modern living with this 4-bedroom, 3-bathroom updated home tailored for comfort and entertainment. The open concept kitchen, complete with an island, seamlessly connects to the living room adorned by a fireplace, creating a...
$104,300
$104,300
Available: Right Now
Brand New-Like Remodeled and Flashy Home! Open Floorplan. Gorgeous Mountain Views! New Kitchen Cabinets, Pantry, Designer Drop Down Vent and Appliances. New Energy Efficient Windows! New Wood-Like Laminate Flooring. Oversized Master Suite with Sepera...
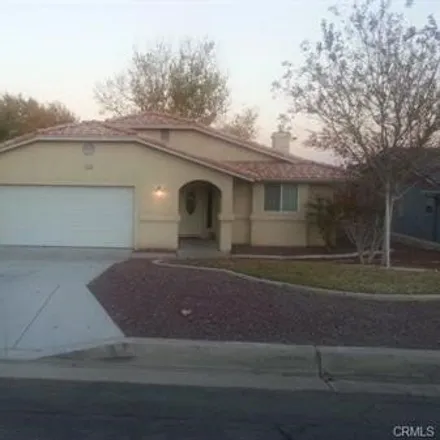
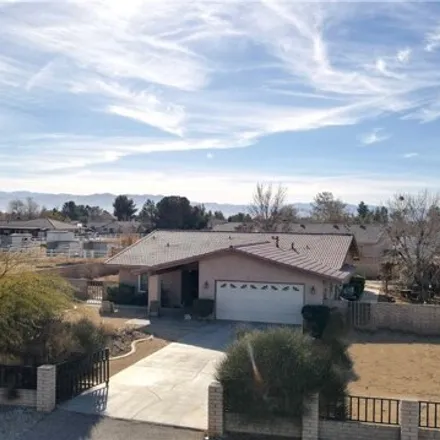
$429,900
$429,900
Available: Right Now
Nestled in the heart of Apple Valley with a massive 0.69 acres of land and a beautiful view of the mountains to the east. With 1144 SqFt, This Cozy home features 3 rooms 2 bathrooms and a 2 car garage. Step in into your new kitchen which is fully loa...
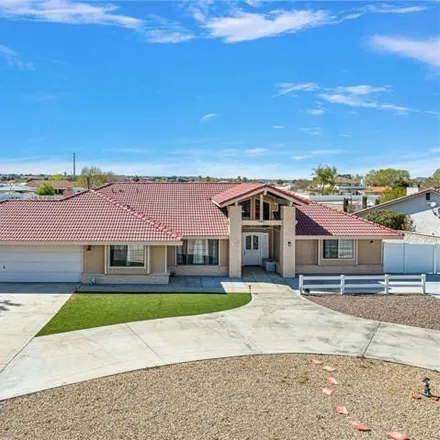
$635,000
$635,000
Available: Right Now
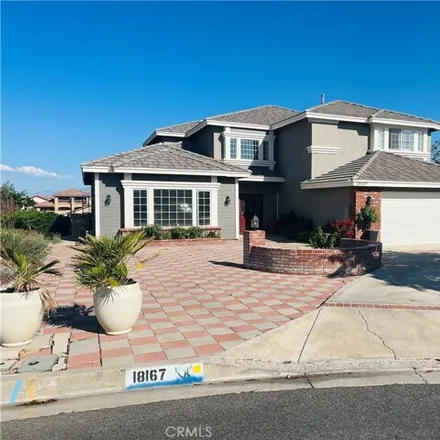
Are you looking for a 4-5 bedroom home? this home boasts 5 bedrooms and 3 full baths. Check out this well maintained beauty! Excellent Location! As you enter this dazzling home notice the light bright formal living and dining room on your right. Cont...
$667,300
$667,300
Available: Right Now
Nestled within the exclusive Dorada at Vista Del Sol gated community, this Residence 2 model offers the epitome of contemporary elegance and comfort. Boasting 2639 square feet of meticulously crafted living space, this home is a true gem. 3 bedrooms,...
$399,900
$399,900
Available: Right Now
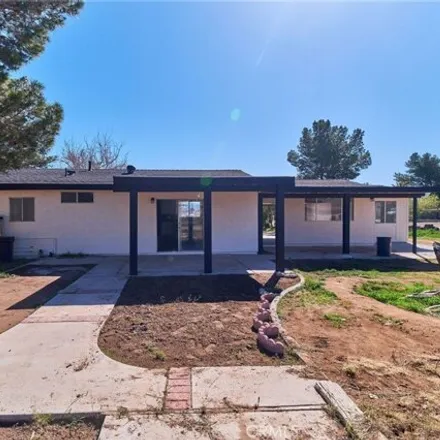
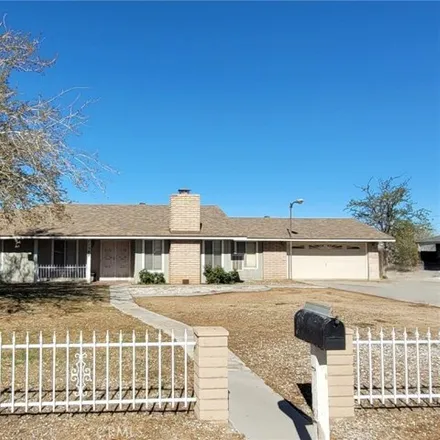
Discover the perfect blend of comfort and convenience with this charming ranch style home located in the heart of Apple Valley. Step inside to find a cozy living space with new carpet, where natural light pours in through the windows, creating a warm...
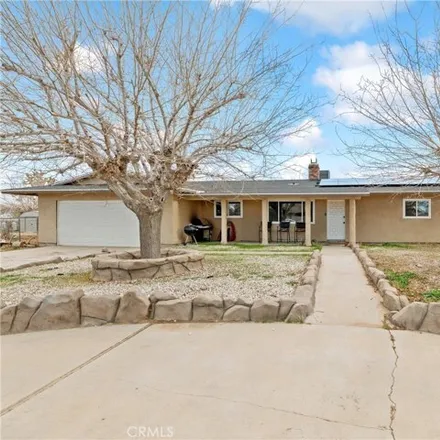
$375,000
$375,000
Available: Right Now
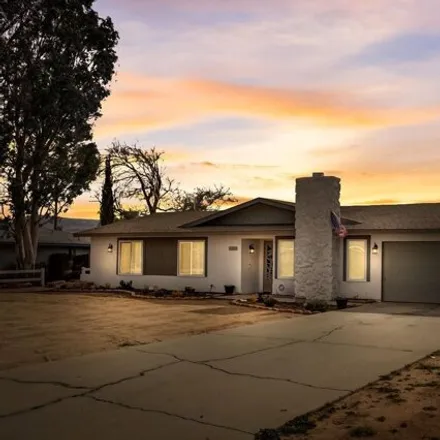
Charming three-bedroom, two-bath home situated on a spacious half-acre lot, offering endless potential! The living room seamlessly flows into the dining area, complemented by a cozy fireplace. The beautiful kitchen has plenty of storage and styled wi...
$450,000
$450,000
Available: Right Now
Inviting single-family, charming 3-bedroom, 2-bathroom home boasts a generous1, 540sqft with an added bonus room of approximately 120 sqft, providing additional space for your needs. Inside, the updated kitchen enhances the home's appeal, offering a ...
$630,000
$630,000
Available: Right Now
Experience the exceptional lifestyle of Spring Valley Lakes in this stunning home nestled on the equestrian side. This vibrant community offers a 200-acre private lake for boating, swimming, skiing, and fishing, as well as equestrian amenities like h...
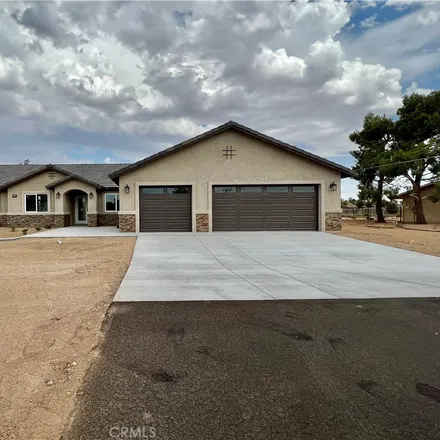
$489,900
$489,900
Available: Right Now
New construction home in Apple Valley! Paid off solar !!! This stunning 2111 sq. ft. home consists of 4 bedrooms, 2.5 bathrooms with a oversized three car garage. It's situated on almost half an acre lot. Flowing throughout this gorgeou...
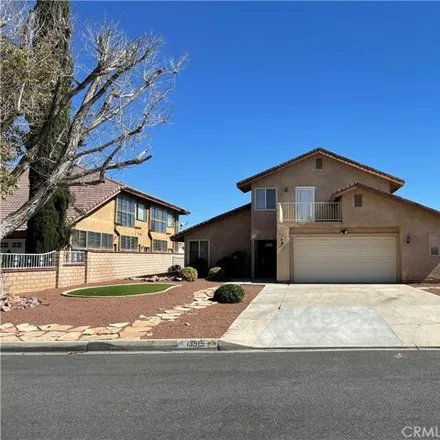
$429,000
$429,000
Available: Right Now
$689,500
$689,500
Available: Right Now
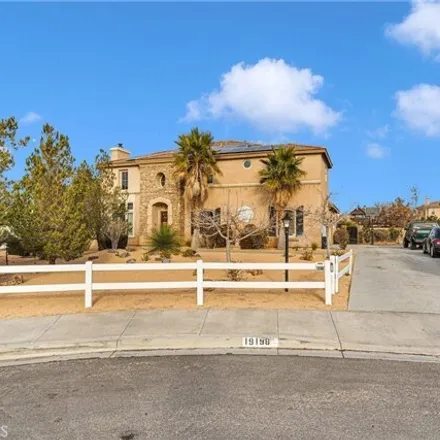
Experience unparalleled luxury living in the prestigious Ranch at Branding Iron with this impeccably upgraded residence, where entertaining becomes an art form and every gathering is a celebration. Spanning3, 398square feet of impeccable design, this...

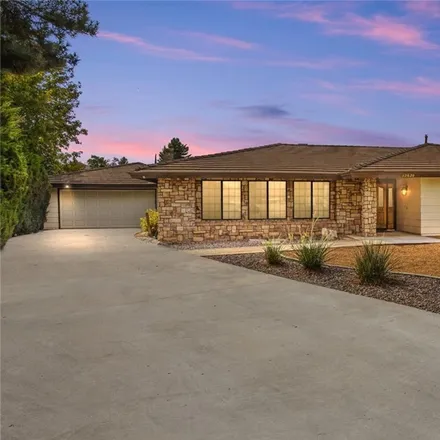
$445,000
$445,000
Available: Right Now
With its upgrades and desirable location, this property provides the perfect combination of comfort, convenience, and style. This is an incredible home in Apple Valley, CA! This home offers an open floor plan, spacious dining room, and large living r...
Apple Valley
According to statistics, the population in Apple Valley, CA amounts to 71,916, which shows decline 1% compared to the previous year. The median age of the city’s residents is 37. The average household income is $50,907, shifting growth 7% from the past year, and the average property value in Apple Valley, CA growth 11% to $215,800 throughout the year.
| Population | 71,916 |
| Median Age | 37.2 |
| Poverty Rate | 18% |
| Household Income | $50,907 |
| Number Of Employees | 25,484 |
| Median Property Value | $215,800 |
What is the Average Price of Apartments for Sale in Apple Valley, CA?
| Month | Median Price |
|---|---|
| Mar 2024 |
$332,852
|
| Feb 2024 |
$332,852
|
| Jan 2024 |
$332,852
|
| Dec 2023 |
$332,852
|
| Nov 2023 |
$247,122
|
| Oct 2023 |
$252,032
|
| Month | Median Price |
|---|---|
| Mar 2024 |
$451,062
|
| Feb 2024 |
$451,062
|
| Jan 2024 |
$451,062
|
| Dec 2023 |
$451,062
|
| Nov 2023 |
$358,532
|
| Oct 2023 |
$406,607
|
Household Income
The average household income in Apple Valley, CA grew from $47,433 to $50,907 in the past year. This data is an estimate based upon 23,911 households in Apple Valley, CA . The chart below presents how household income is distributed in Apple Valley, CA in comparison to the revenue allocation amid households nationally.
Property Value
According to data from last year, the average property value in Apple Valley, CA shifted from $194,100 to $215,800 throughout the year. The subsequent graph indicates the share of properties in the given price range in Apple Valley, CA in comparison to the median property value in the same price segment across the country. According to the data, the greatest share of Apple Valley, CA properties falls in the '$200,000 to $249,999' range, which is higher than the most significant median property across the country.
Rent vs. Own
Property Taxes
One of the most important aspects for property owners is the amount of property taxes. This graph shows distribution of property taxes in Apple Valley, CA compared to median property taxes around the country. The prevalent amount of property taxes in Apple Valley, CA equals $2500, which is less than the national average.