Auburn, CA, USA apartments for sale
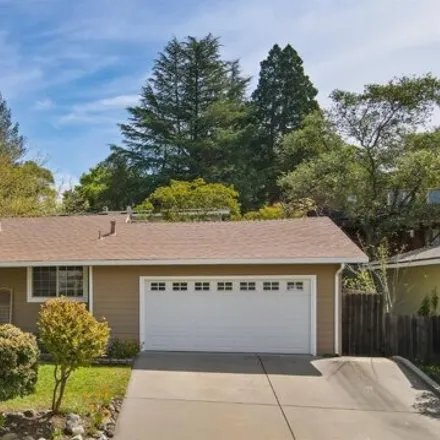
$525,000
$525,000
Available: Right Now
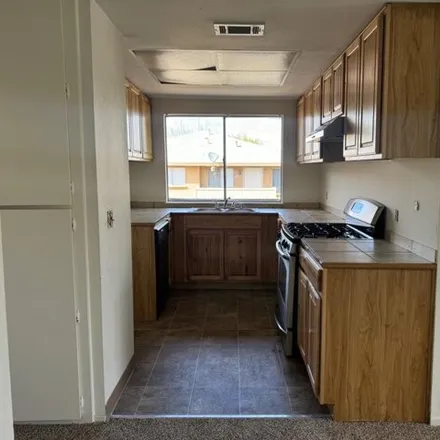
Step into this charming home featuring thoughtful updates throughout. Nestled in an established community you will instantly fall in love! From the moment you enter, you are greeted with the updated interior and inviting layout. Enjoy the updated kit...
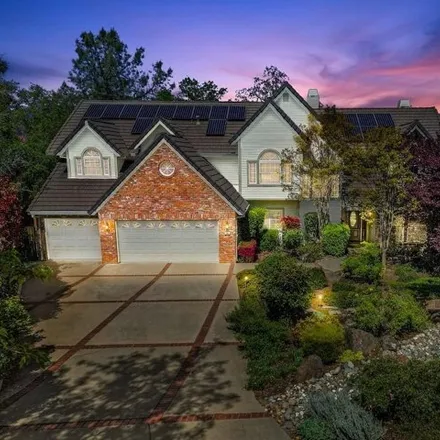
$1,2M
$1,2M
Available: Right Now
South Auburn home that was built for entertaining and family fun! The current owners have enjoyed this home for close to 12 years and now it's time for a new owner to enjoy this spacious, amenity filled property. The large kitchen is great for everyd...
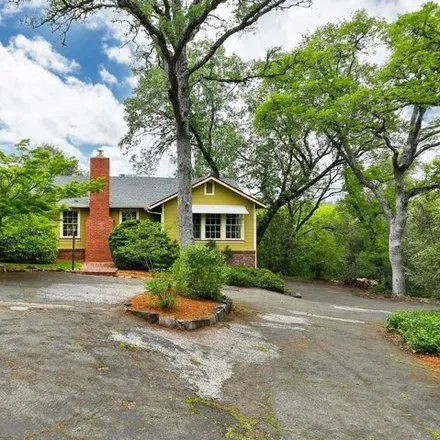
$599,000
$599,000
Available: Right Now
Prime Location! Situated in a coveted area, relish the convenience of being close to downtown Auburn and the American River Canyon near the Stagecoach hiking trail. Enjoy the serenity of a peaceful neighborhood as this 1612 sq ft, 3 bedrooms, 2 bath ...
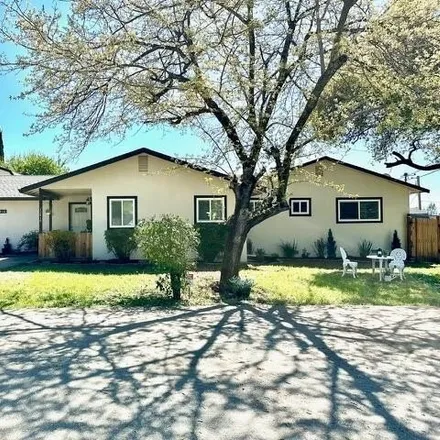
$897,700
$897,700
Available: Right Now
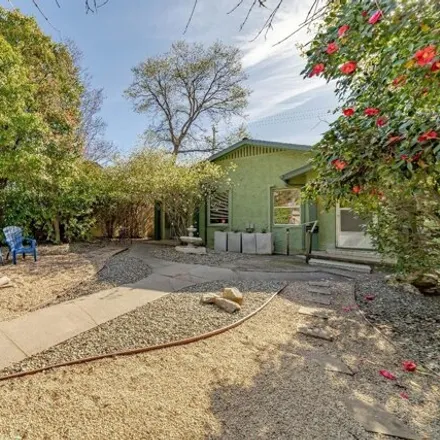
Welcome home. Location location location! This beautifully upgraded craftsman style home and guest house is located in the scenic foothills of Auburn, just minutes from shopping. Enjoy this extra large lot that is almost 4/10 of an acre, giving plent...
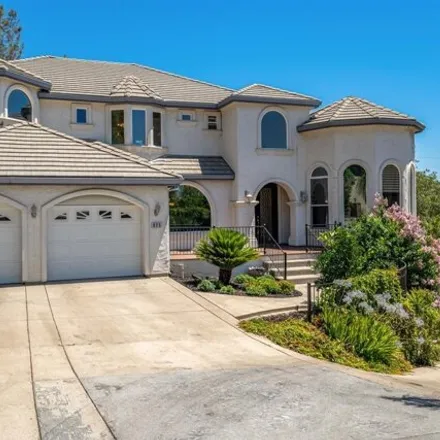
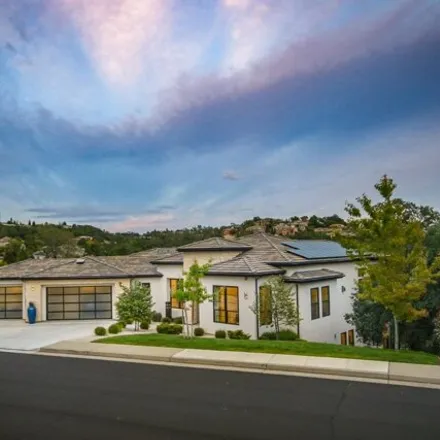
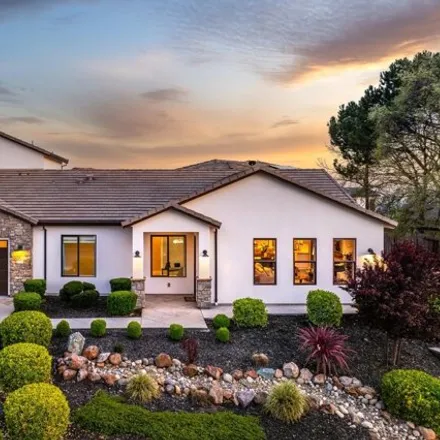
$949,900
$949,900
Available: Right Now
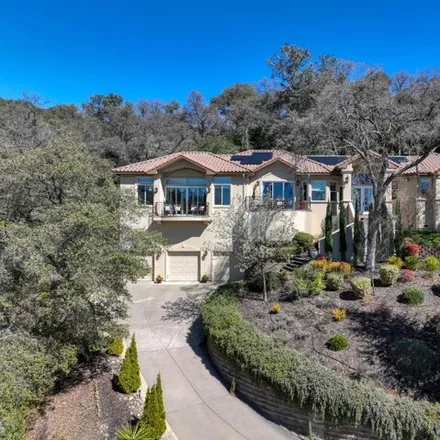
Welcome to your dream home at Granite Bay Vista! Nestled on a serene half-acre cul-de-sac lot with captivating views of Folsom Lake, this spacious residence exudes charm and luxury. Step inside through grand double beveled glass doors to discover an ...
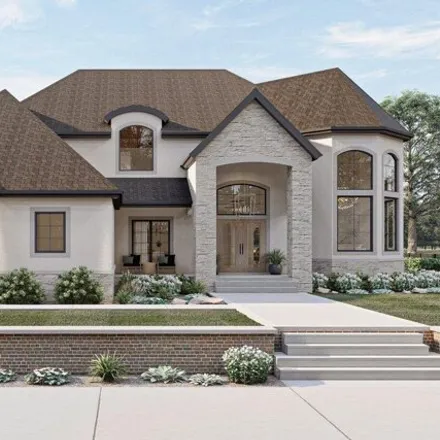
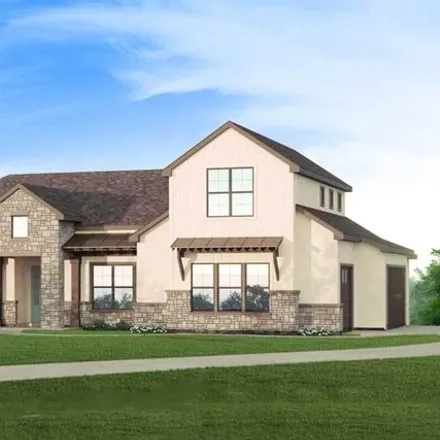
$1,5M
$1,5M
Available: Right Now
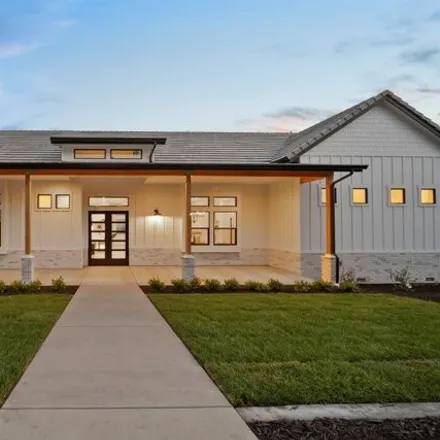
Traditional-style, 2-story house planned in South Auburn! From the covered front porch, an entry hall greets guests with its high ceiling and open views into the dining room. Head from the great room into the living room, where the fireplace becomes ...
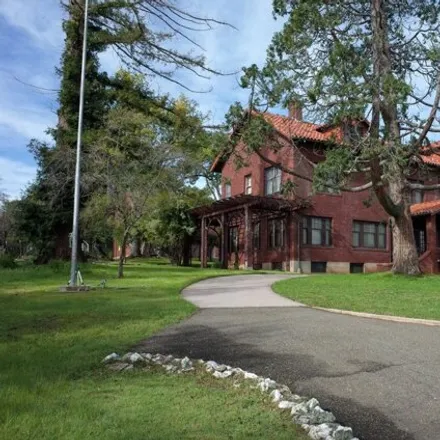
$2,25M
$2,25M
Available: Right Now
Absolutely striking historically significant Federalist style home in the heart of Auburn on over 5 acres. Fantastic mostly original condition. Home has original operational elevator. 3 sunrooms. Full attic and basement. Gorgeous crown molding. Main ...
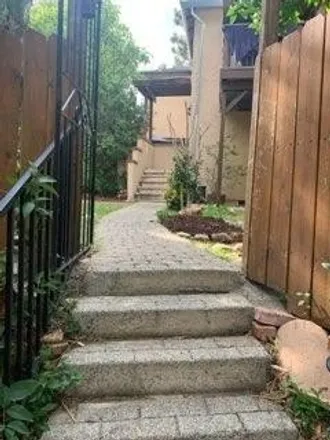
$642,000
$642,000
Available: Right Now
Peaceful get away. Stairway leads to the fully remodeled upstairs unit with beautiful laminate flooring, granite countertops, decorator paint, update cabinets, chef's dream kitchen. Deck off of the kitchen has a spectacular view (The sunsets are amaz...
$2,2M
$2,2M
Available: Right Now
Welcome to an architectural masterpiece nestled amidst nature's beauty! Immerse yourself in the serene ambiance of rolling hills and an unending canopy of trees, all visible from its multi-level terraces. As you step inside, you'll be immediately cap...
$310,000
$310,000
Available: Right Now
Much desired end unit in Auburn Woods. New flooring throughout. New light fixtures throughout, upgraded appliances, washer/dryer combo. Private fenced back patio. Great location near private pond and pool, mail collection and covered parking. Newer A...
$1,9M
$1,9M
Available: Right Now
Exclusive Hill Country home will be the epitome of open-concept living! The living room, adorned with four oversized windows and back door leading to a covered porch, perfect for lounging, dining al fresco, or hosting barbecues. Kitchen boasts an isl...
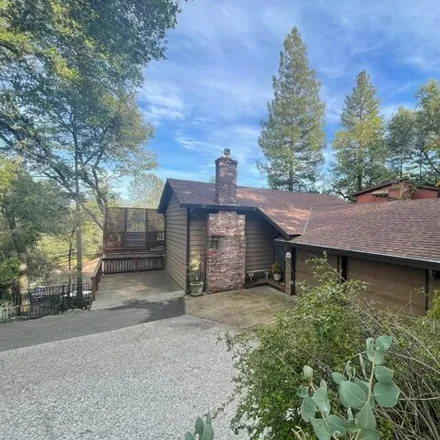
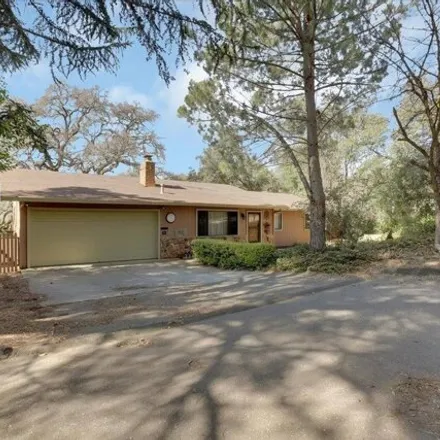
$649,000
$649,000
Available: Right Now
Enjoy the quiet, soothing sounds of nature from this custom 2 or 3 bedroom home located in Auburn's most desirable area. Listen to the sounds of a seasonal creek, birds singing, and enjoy the views from your two decks. Walk 3 min. to Stagecoach trail...
$1,03M
$1,03M
Available: Right Now
This gorgeous single-story home with a bonus upstairs family room, features a bright great room that overlooks the newly landscaped backyard with a tranquil waterfall feature and beautiful plants including Japanese maples. The seller also installed t...
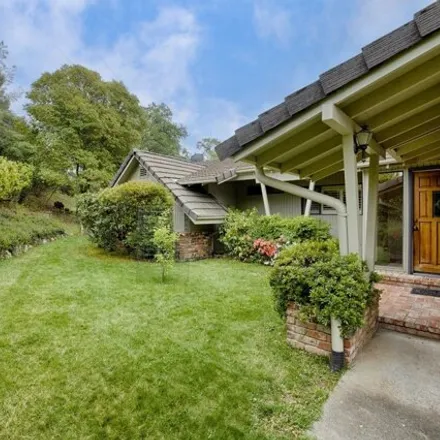
$580,000
$580,000
Available: Right Now
Step into the welcoming embrace of your dream family home, tucked away on a serene, ultra-private street in the heart of sought-after downtown Auburn. This beautifully placed gem beckons with a recently remodeled kitchen, tailor-made for culinary adv...

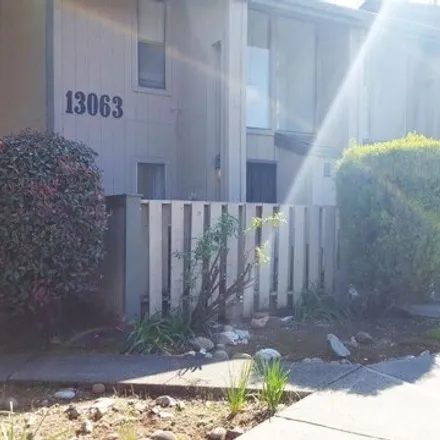
$239,900
$239,900
Available: Right Now
Bright, updated, move-in ready, well maintained 2 bedroom 1 bathroom condo. This newer kitchen features LG stainless steel appliances, butcher block counters and additional pantry space. Newer bathroom remodel and along with newer laminate flooring t...
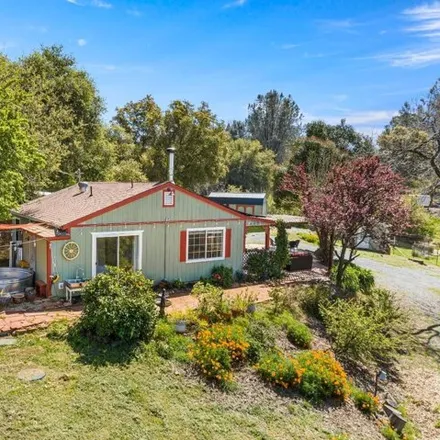
$524,999
$524,999
Available: Right Now
Welcome to your private, off-grid oasis - a homesteader's dream and an animal lover's paradise! Nestled on a stunning 1-acre lot, this homestead offers a serene escape from the hustle and bustle of city life while only being a 4-minute drive from Nor...
$700,000
$700,000
Available: Right Now
RARE opportunity in Auburn! Less than a mile to American River Trials, Downtown AND Old Town! Only a couple of blocks to Placer HS. Perfect location! Over2, 900sq.ft. This 3-4 bed, 3 full bath home has plenty of room for all of your friends and famil...
$595,000
$595,000
Available: Right Now
Location! Location! Location! This adorable 1928 duplex cottage has been lovingly cared for and is the last property located on a quiet cul-de-sac. Residents enjoy a path into the heart of downtown Auburn with restaurants, shops, theatre, and communi...
$1,35M
$1,35M
Available: Right Now
This luxurious single-story dream home offers stunning 180-degree views of Folsom Lake, American River, Downtown Sacramento, the Valley, Foothills, and Mount Diablo in the Bay. It features large decks, an open floor plan, gourmet kitchen with an over...
$975,000
$975,000
Available: Right Now
See video !! VIEWS!! SOLAR!! Welcome to your dream home nestled in the prestigious Granite Bay Vista community! This single-story sanctuary boasts luxury at every turn. Step inside to discover newly installed European Oak floors that exude war...
$210,000
$210,000
Available: Right Now
Welcome to your opportunity to transform this light and bright condo into the home of your dreams or a lucrative investment opportunity! Nestled in a convenient Auburn neighborhood, this condo has new paint and carpet, 2 bedrooms and 1 bath, one cove...
$675,000
$675,000
Available: Right Now
Welcome home to comfort, luxury, and convenience in the prestigious and well-established Stonebrook HOA. This well-equipped residence boasts 4 beds, 2 baths, and 2025 square feet of living space. As you step inside, you're greeted by a warm ambiance,...
Auburn
According to statistics, the population in Auburn, CA amounts to 13,911, which shows decline 0% compared to the previous year. The median age of the city’s residents is 48. The average household income is $57,289, shifting growth 6% from the past year, and the average property value in Auburn, CA growth 6% to $393,500 throughout the year.
| Population | 13,911 |
| Median Age | 48 |
| Poverty Rate | 12% |
| Household Income | $57,289 |
| Number Of Employees | 6,338 |
| Median Property Value | $393,500 |
What is the Average Price of Apartments for Sale in Auburn, CA?
| Month | Median Price |
|---|---|
| Apr 2024 |
$349,410
|
| Mar 2024 |
$349,410
|
| Feb 2024 |
$349,410
|
| Jan 2024 |
$349,410
|
| Dec 2023 |
$332,288
|
| Nov 2023 |
$271,795
|
| Month | Median Price |
|---|---|
| Apr 2024 |
$510,776
|
| Mar 2024 |
$660,087
|
| Feb 2024 |
$660,087
|
| Jan 2024 |
$660,087
|
| Dec 2023 |
$433,950
|
| Nov 2023 |
$389,079
|
Household Income
The average household income in Auburn, CA grew from $54,227 to $57,289 in the past year. This data is an estimate based upon 6,007 households in Auburn, CA . The chart below presents how household income is distributed in Auburn, CA in comparison to the revenue allocation amid households nationally.
Property Value
According to data from last year, the average property value in Auburn, CA shifted from $371,000 to $393,500 throughout the year. The subsequent graph indicates the share of properties in the given price range in Auburn, CA in comparison to the median property value in the same price segment across the country. According to the data, the greatest share of Auburn, CA properties falls in the '$300,000 to $399,999' range, which is higher than the most significant median property across the country.
Rent vs. Own
Property Taxes
One of the most important aspects for property owners is the amount of property taxes. This graph shows distribution of property taxes in Auburn, CA compared to median property taxes around the country. The prevalent amount of property taxes in Auburn, CA equals $3000, which is less than the national average.