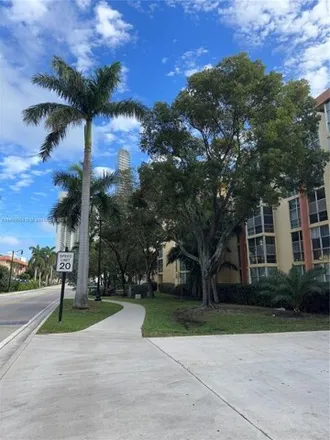
Aventura, FL, USA apartments for sale

$450,000
$450,000
Available: Right Now
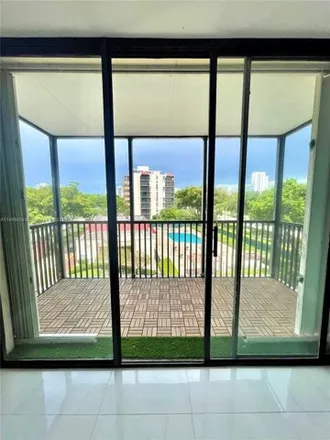
Attention-attention investors ! Unit can be rented right away ! Vacant unit ! Basic cable and internet include with hoa ! Garden and golf views, beautiful sunsets, enjoy the 4th of july fireworks from your balcony, walk...

$2,3M
$2,3M
Available: Right Now
This spectacular, furnished, and decorated3BD/4.5BAunit is one of the best lines at Echo Aventura. Residence has a private elevator and foyer, high ceilings, a bright and spacious layout, smart home technology with in-ceiling audio, an oversized balc...

$1,9M
$1,9M
Available: Right Now
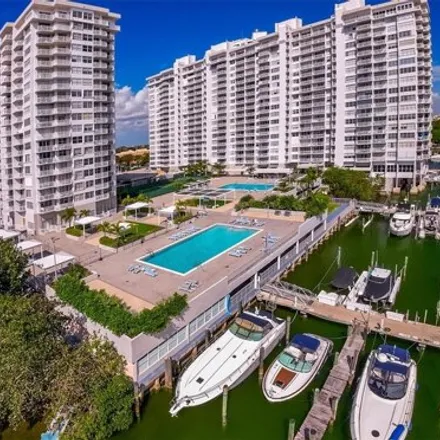
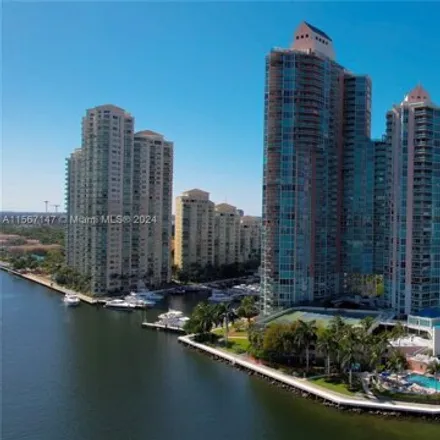
Boaters exclusive paradise condo and Boat slip with full amenities available! Marina Palms best residence unit available (line 9) with panoramic view of Intracoastal Waterway and Ocean. 3 bdr + 3.5 bth vibrant concept with natural ambiance lighting t...
$335,000
$335,000
Available: Right Now
Experience exceptional Open Water and City Views from this bright and updated 2B/2B oasis on the 16th Floor of Del Prado Aventura. This spacious 1565 Sqf Ft Unit offers abundant storage, two balconies for maximum light and stunning city sunsets. Impa...
$323,000
$323,000
Available: Right Now
Completely renovated 2 bedroom 2 bathroom apartment in the heart of Aventura. Everything in the apartment is brand new and unused. Corner unit overlooking the pool, located on the beautiful Aventura circle (3 mile path for walking, jogging, etc). Wal...
$2,3M
$2,3M
Available: Right Now
Gorgeous 3-bedroom, 4.5-bathroom corner unit with panoramic views from every room. Step inside through a private elevator and a grand hallway. Revel in the open living space with elegant marble floors, and a wraparound balcony offerings stunning vist...

$775,000
$775,000
Available: Right Now
One of a kind. Completely remodeled 2 beds plus den and 2 full bathrooms.Enjoy the most beautiful and spectacular panoramic views of the ocean, Turnberry Golf course, skyline from this spacious apartment in the prestigious Mystic Pointe.Apartm...
$545,000
$545,000
Available: Right Now
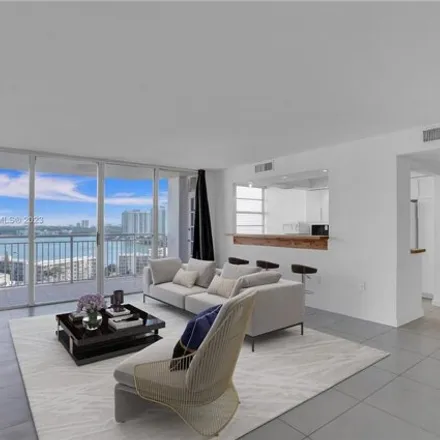
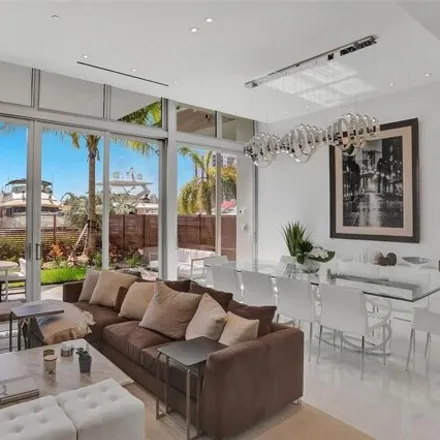
Experience breathtaking panoramic views of the city and bay from this impeccably renovated 2-bedroom, 2-bathroom Penthouse. Delight in the mesmerizing sunsets while lounging on your expansive wraparound balcony. The kitchen boasts state-of-the-art ap...

$390,000
$390,000
Available: Right Now
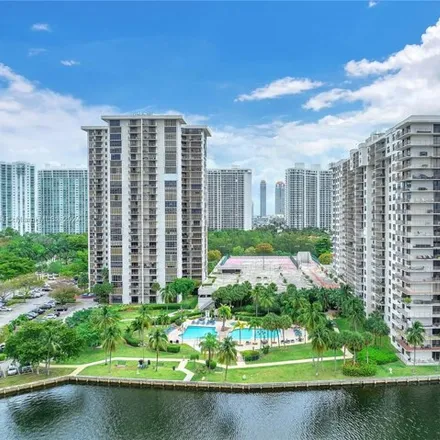
Amazing eye-catching views of the golf course and lakes, 2/2 remodeled split floor plan. Marble floors throughout, granite countertops, stainless steel appliances. Extra cabinets in kitchen, Walking Closets, washer, and dryer in unit. Hurricane shutt...

$899,000
$899,000
Available: Right Now
Welcome Home to this Luxurious renovated turn Key unit with 180 degree VIEWS of the ocean, Intracoastal and Turnberry golf course. This elegant unit has been meticulously renovated A-Z in the finest of quality and taste Featuring an opulent modern op...
$299,900
$299,900
Available: Right Now
Reduced for a quick sale..location..location..location enjoy this renovated fully furnished unit in the heart of sunny ilses beach ! One block from the ocean and Walking distance to restaurants, shopping centers, grocery stores, reta...

$649,000
$649,000
Available: Right Now
Beautiful 3-bedroom, 2-bathroom apartment has it all. Newly updated 2024 kitchen, upgraded floors, and stylish window treatments. Located in a recently renewed building with breathtaking intracoastal views, this unit offers unparalleled luxury. Enjoy...

$535,000
$535,000
Available: Right Now
Corner unit. AMAZING 2bed 2 bath in Aventura! Balconies overlooking the golf course. Washer and dryer inside the unit. Walking Closet in both rooms. Very comfortable, bright and dynamic apartment. The building offers a 24-hour concierge, a relaxing p...

$419,000
$419,000
Available: Right Now
Stunning Condo luxurious breathtaking completely renovated by Interior Designer, ready to move in. 2 beds/ 2baths with fine finishes, beautiful throughout porcelain floors, smooth ceilings, Custom kitchen with Stainless Steel Appliances including an ...
$2,79M
$2,79M
Available: Right Now
Welcome to this stunning unit surrounded by luxury and elegance at the exclusive Bella Mare Condo, Williams Island. With Spectacular and panoramic ocean and intracoastal views it counts with 3-bedroom, 3.5-bathroom on 2840 SqFt of opulent living spac...
$5,6M
$5,6M
Available: Right Now
Discover the ultimate waterfront haven within the exclusive Eastern Shores community. Spanning over6, 000square feet on a vast13, 565square-foot lot, this recently renovated masterpiece represents the best of waterfront living. Step into the grand fo...
$560,000
$560,000
Available: Right Now
Discover the perfect waterfront condo in Aventura! This airy unit boasts an open floor plan with stunning bay views. Featuring a 2-bdrm split layout, both rooms offer amazing vistas. The kitchen has stainless steel appliances, an eat-in area, 5-star ...
$3,5M
$3,5M
Available: Right Now
Waterfront Modern Marvel - 3 story TH located in Aventura. Newly built, 2022 with four(4) BD and five and a half (5.5) BA approx 3500 of interior sq.ft. This was a model unit designed and finished by Interiors by Steven G, featuring porcelain floors ...
$789,569
$789,569
Available: Right Now
Corner unit extraordinare in hidden bay ! Enter through semi-private elevator foyer + Immediately be wowed by the most incredible panoramic ocean, bay, city, marina and sunrise + Sunset views due to this fabulous wide-open flo...

$1,75M
$1,75M
Available: Right Now
Unique Penthouse apartment with 2 bedrooms and 2, 5 bathrooms in a luxury building of Echo Aventura. The apartment has the private huge-size rooftop terrace with private plunge pool and incredible water views. The unit is completely furnished and des...
$499,500
$499,500
Available: Right Now
Best luxury finishing in aventura - Biscayne Cove Condo offers an exquisite selection of luxury apartments in aventura, boasting brand new interior finishing starting from$ 499, 500.00.these 3/2 or 2/2 plus den residences are situated in the p...

$618,000
$618,000
Available: Right Now
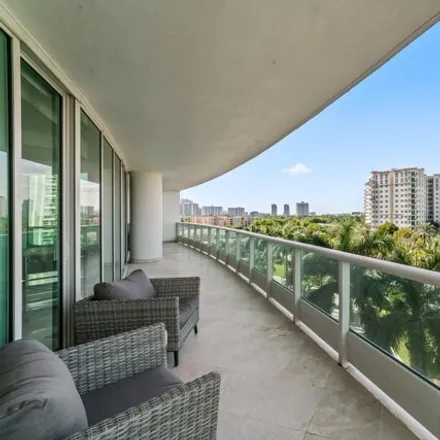
Experience unparalleled luxury and breathtaking views in this stunning 2-bed, 2-bathroom corner unit, complete with a den and a wrap-around balcony. Nestled in the prestigious Mystic Pointe Tower 500, this residence offers panoramic views of the wate...
Aventura
According to statistics, the population in Aventura, FL amounts to 37,875, which shows decline 1% compared to the previous year. The median age of the city’s residents is 50. The average household income is $57,388, shifting growth 3% from the past year, and the average property value in Aventura, FL growth 5% to $325,400 throughout the year.
| Population | 37,875 |
| Median Age | 49.7 |
| Poverty Rate | 10% |
| Household Income | $57,388 |
| Number Of Employees | 17,332 |
| Median Property Value | $325,400 |
What is the Average Price of Apartments for Sale in Aventura, FL?
| Month | Median Price |
|---|---|
| Jun 2024 |
$325,559
|
| May 2024 |
$270,055
|
| Apr 2024 |
$309,779
|
| Mar 2024 |
$309,779
|
| Feb 2024 |
$309,779
|
| Jan 2024 |
$309,779
|
| Month | Median Price |
|---|---|
| Jun 2024 |
$660,339
|
| May 2024 |
$704,584
|
| Apr 2024 |
$848,680
|
| Mar 2024 |
$848,680
|
| Feb 2024 |
$848,680
|
| Jan 2024 |
$848,680
|
Household Income
The average household income in Aventura, FL grew from $55,891 to $57,388 in the past year. This data is an estimate based upon 18,888 households in Aventura, FL . The chart below presents how household income is distributed in Aventura, FL in comparison to the revenue allocation amid households nationally.
Property Value
According to data from last year, the average property value in Aventura, FL shifted from $310,300 to $325,400 throughout the year. The subsequent graph indicates the share of properties in the given price range in Aventura, FL in comparison to the median property value in the same price segment across the country. According to the data, the greatest share of Aventura, FL properties falls in the '$300,000 to $399,999' range, which is higher than the most significant median property across the country.
Rent vs. Own
Property Taxes
One of the most important aspects for property owners is the amount of property taxes. This graph shows distribution of property taxes in Aventura, FL compared to median property taxes around the country. The prevalent amount of property taxes in Aventura, FL equals $3000, which is less than the national average.