Avondale, AZ, USA apartments for sale
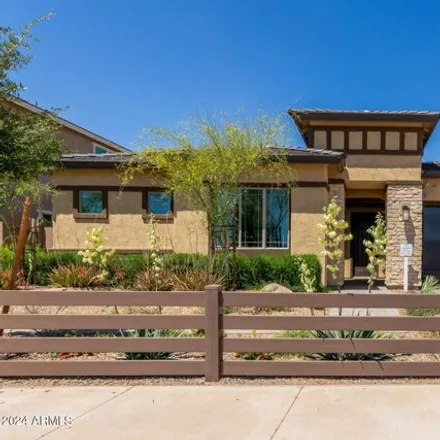
$699,900
$699,900
Available: Right Now
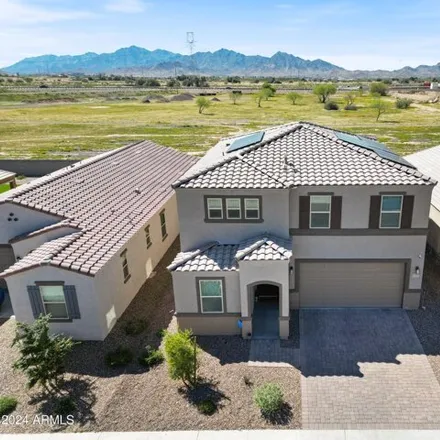
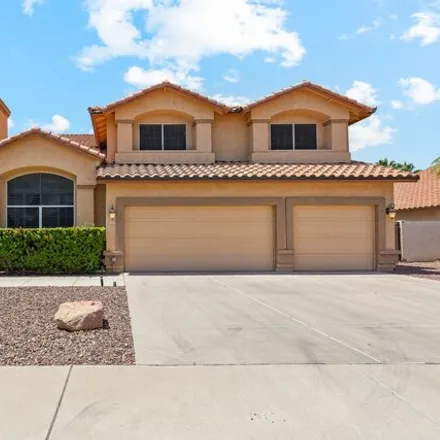
Former model home in the master planned community of Alamar w/tons of Designer upgrades throughout! Fantastic curb appeal w/paver driveway, stone columns + full landscaping! This energy efficient home features aGOURMETkitchen w <...
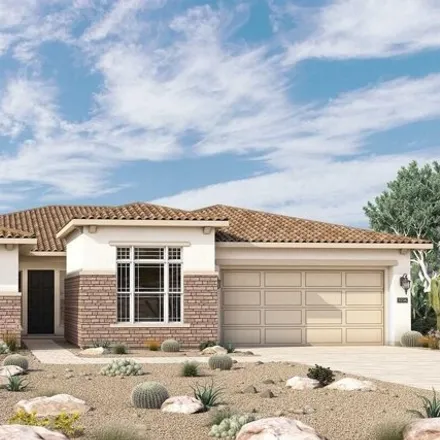
$622,445
$622,445
Available: Right Now
10' ceilings, 8' doors and large, energy efficient windows allowing in an abundance of natural light highlight this gorgeous 4 bed, 3.5 bath open plan with enclosed study in Alamar. Enjoy trying new recipes in the gorgeous gourmet kitchen boasting pa...
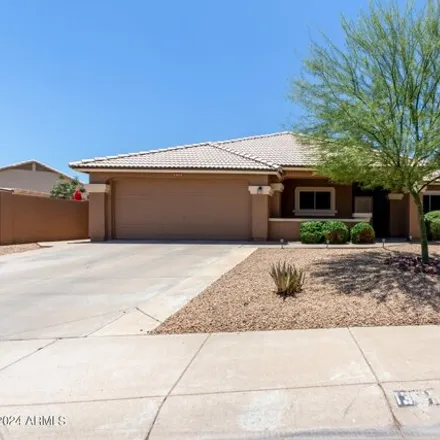
$490,000
$490,000
Available: Right Now
Discover this stunning single-level home on an oversized premium golf course lot in the sought-after Palm Valley Community! This beautifully updated residence features an open floor plan, vaulted ceilings, wood-look tile flooring, and expansive windo...
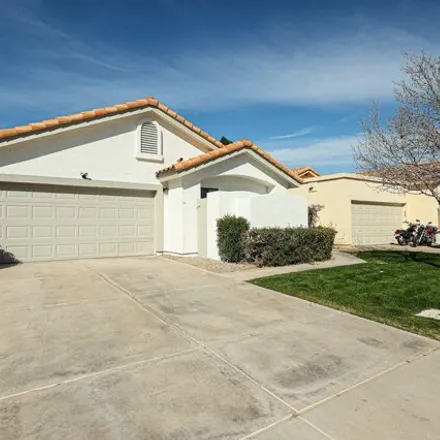
$589,900
$589,900
Available: Right Now
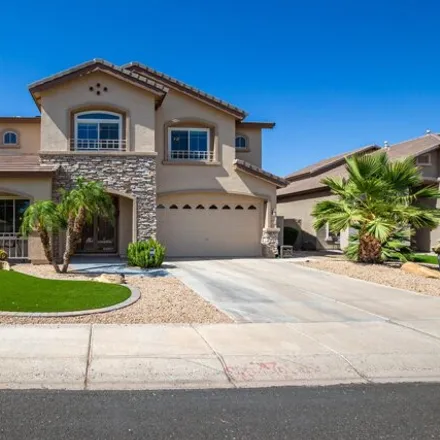
Fully remodeled Lakefront 3 bed 2 bath in highly sought after Garden Lakes! Home was updated top to bottom, inside/out with the highest quality finishes! Over $100k in upgrades! Home features: New tile roof in March 2023, vaulted ceilings, new...
$525,000
$525,000
Available: Right Now
Stylish two story home built in 2022 with an open floor plan and a generous great room! Kitchen includes white cabinets with black matte hardware, center island, large single-basin sink, Whirlpool stainless steel appliances and a large pantry. A bedr...

$370,000
$370,000
Available: Right Now
This charming single level home is currently being renovated and priced below market. Take advantage of this lovely home with new paint, LVP flooring and new carpet and blinds. Located on an interior lot with no neighbors behind home! Generous cabine...
$1,3M
$1,3M
Available: Right Now
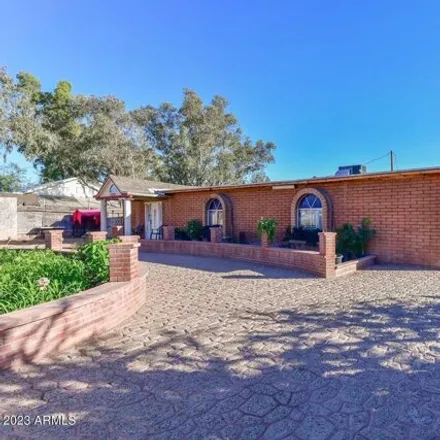
1.25 Acre Home with NoH.O.A,Lots of rooms to build additional casita, Huge workshop, Home features 4 bedrooms, 3 bathrooms, an Arizona enclosed patio, tile floors, new kitchen with granite counters and stainless steel appliances, new roof, new AC uni...
$455,900
$455,900
Available: Right Now
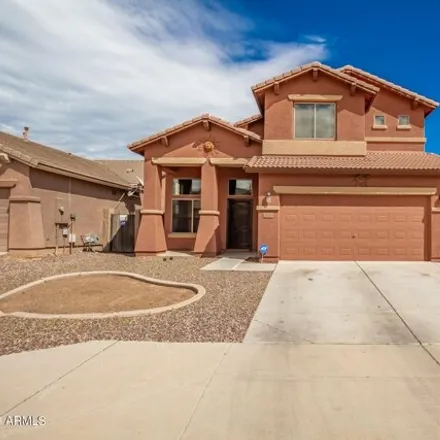
Pride of ownership is shown in this beautiful two-story home in Country Place! Delightful interior features a complementing soothing palette and red tile flooring. The inviting great room is bathed with natural light and has vaulted ceilings, creatin...
$700,000
$700,000
Available: Right Now
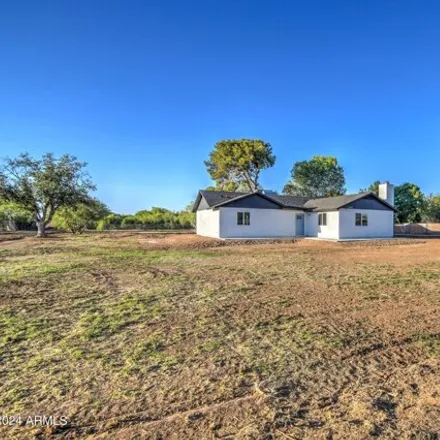
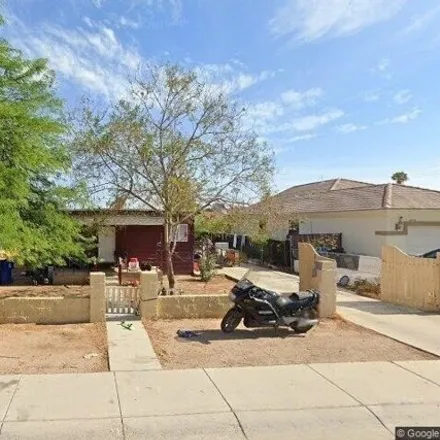
This beautifully remodeled home in Avondale sits on a sprawling one-acre lot, perfect for those who desire space and tranquility. The house boasts a brand-new kitchen featuring modern appliances and elegant finishes. Freshly installed flooring throug...
$789,900
$789,900
Available: Right Now
Exquisite 2-story home that will take your breath away all on approx. of an acre. Stunning 5 spacious bedrooms and 3 luxurious bathrooms, providing ample space! As you enter, you'll be greeted by magnificent wrought iron security doors and double ent...

$379,900
$379,900
Available: Right Now
Welcome to this charming single level home in Avondale, AZ. This freshly painted house features a spacious open floor plan with new carpet throughout. With 3 bedrooms and 2 bathrooms, this home offers comfortable living spaces for you to enjoy. The l...

$410,000
$410,000
Available: Right Now
Don't wait any longer! Come and start creating lasting memories in this delightful 3-bedroom home in Park Forest! It features a cozy living room and an inviting great room, ideal for making cherished memories. The lovely kitchen is equipped with whit...

$382,500
$382,500
Available: Right Now
Lease purchase option available ! A charming 3 bed, 2 bath home in Phoenix is now for sale! Nestled on a premium corner lot and featuring a charming facade w/brick veneer accents, a low-care landscape, and a front patio. Discover a sizeable li...

$380,000
$380,000
Available: Right Now
Stunning 3bedroom 2bathroom property. beautiful landscape great backyard space walk in closet with double sink in master bedroom both bathrooms are being remodeled, no mold new toilet in the master new tub and toilet in hallway bathroom property has ...
$440,000
$440,000
Available: Right Now
You need to see this spacious floor plan located in this gated community in the greater Palm Valley area of Goodyear. Step into your living room featuring brand new wood like tile flooring throughout the first floor of the home. Continue through to t...

$430,000
$430,000
Available: Right Now
Fantastic 3-bedroom property nestled in the Farmington Glen Community is the one you've been looking for! You are greeted by a spacious interior showcasing tile flooring, a soothing palette throughout, and modern recessed lighting. The remarkable kit...
$515,000
$515,000
Available: Right Now
Fantastic 5 br 3 full bath home locateds in the much sought after Park Forest neighborhood. Over 3000 sf of open floor planned living space. 3 car garage, fenced back yard, covered back patio, granite countertops, plenty of storage space, one bedroom...
$475,000
$475,000
Available: Right Now
Welcome to this beautifully remodeled 4-bedroom, 2-bathroom home. New quartz countertops, low maintenance flooring and updated bathrooms. Freshly painted inside with new lighting fixtures throughout. This home is conveniently located near top-rated s...

$449,990
$449,990
Available: Right Now
Great opportunity- This loan offers an assumable rate of 4.625% for FHA and VA borrowers! Explore this charming two-story home constructed in 2022 on a premium lot near the University Technical Institute, Luke Air Force Base, lots of shops, en...
$265,000
$265,000
Available: Right Now
Investor special !!! Owner Has other properties which are rentals for sale, tenant occupied! Great property for either investment or yourself. Currently rented at $1991 per month until6/30/24.Tenant wants to stay. Tenant paying for gas/electri...
$413,909
$413,909
Available: Right Now
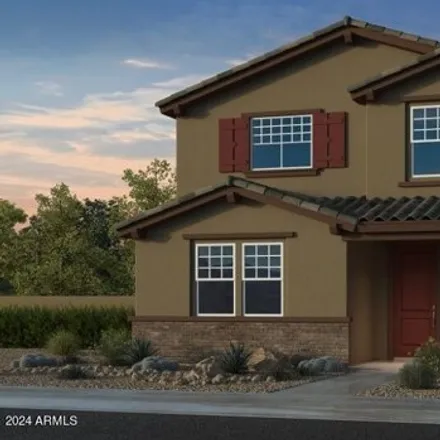
Up to 2% of total purchase price towards closing costs incentive offer. Additional eligibility and limited time restrictions apply. MLS#6679388June Completion! Welcome to theCC-RM3floorplan, now available at the Parkside Villas Collection. This 3-bed...
$609,900
$609,900
Available: Right Now
Come see this incredible five bedroom home located in popular Avondale! Very open and light with separate family and living rooms plus an oversized cook's kitchen with numerous cabinets, granite counters and a full length breakfast bar. Upstairs is a...
Avondale
According to statistics, the population in Avondale, AZ amounts to 81,590, which shows growth 1% compared to the previous year. The median age of the city’s residents is 31. The average household income is $56,585, shifting decline 1% from the past year, and the average property value in Avondale, AZ growth 9% to $174,800 throughout the year.
| Population | 81,590 |
| Median Age | 31 |
| Poverty Rate | 16% |
| Household Income | $56,585 |
| Number Of Employees | 38,463 |
| Median Property Value | $174,800 |
What is the Average Price of Apartments for Sale in Avondale, AZ?
| Month | Median Price |
|---|---|
| Jun 2024 |
$392,168
|
| May 2024 |
$388,756
|
| Apr 2024 |
$344,550
|
| Mar 2024 |
$344,550
|
| Feb 2024 |
$344,550
|
| Jan 2024 |
$344,550
|
| Month | Median Price |
|---|---|
| Jun 2024 |
$411,902
|
| May 2024 |
$418,590
|
| Apr 2024 |
$403,732
|
| Mar 2024 |
$403,732
|
| Feb 2024 |
$403,732
|
| Jan 2024 |
$403,732
|
Household Income
The average household income in Avondale, AZ grew from $56,120 to $56,585 in the past year. This data is an estimate based upon 25,077 households in Avondale, AZ . The chart below presents how household income is distributed in Avondale, AZ in comparison to the revenue allocation amid households nationally.
Property Value
According to data from last year, the average property value in Avondale, AZ shifted from $160,600 to $174,800 throughout the year. The subsequent graph indicates the share of properties in the given price range in Avondale, AZ in comparison to the median property value in the same price segment across the country. According to the data, the greatest share of Avondale, AZ properties falls in the '$200,000 to $249,999' range, which is higher than the most significant median property across the country.
Rent vs. Own
Property Taxes
One of the most important aspects for property owners is the amount of property taxes. This graph shows distribution of property taxes in Avondale, AZ compared to median property taxes around the country. The prevalent amount of property taxes in Avondale, AZ equals $1150, which is less than the national average.