Baldwin, NY, USA apartments for sale
$649,000
$649,000
Available: Right Now
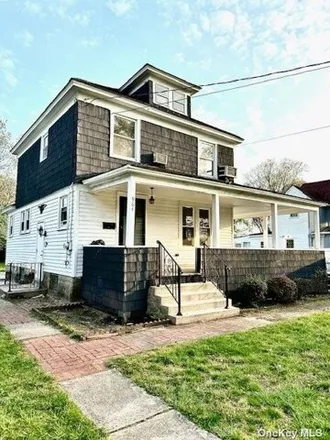
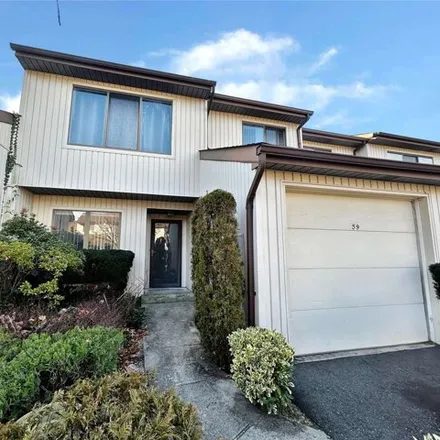
Newly renovated single family in quiet area, living dining half bath and kitchen on first floor, second floor has 3 bedrooms and full bath. full unfinished basement with laundry and utility area. all new plumbing, electrical, new bathrooms brand new ...

$598,888
$598,888
Available: Right Now
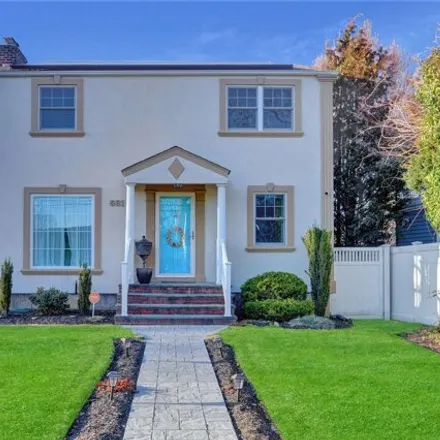
Delivered vacant. this is a 4-bed 2 bath 1900 sq. ft. cape with a 1 car garage and a fully finished basement with a 1 bedroom apartment with a separate entrance on a great block. showings will only be on weekdays between 11 am and 1 pm and on week...

$800,000
$800,000
Available: Right Now
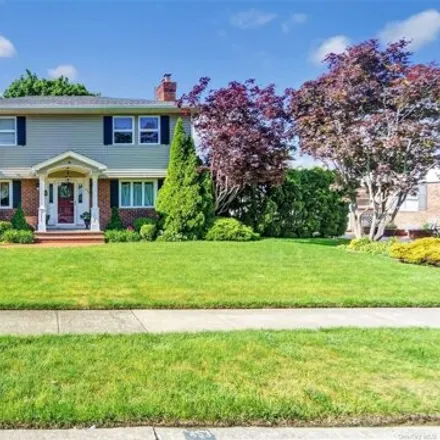
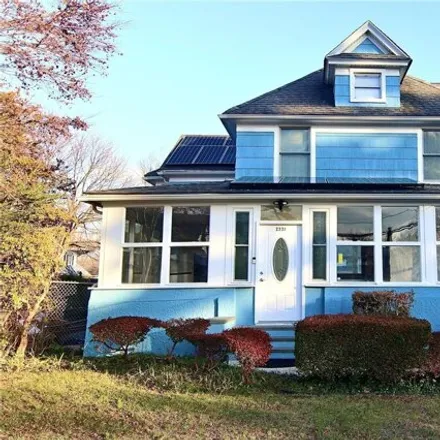
Introducing this captivating colonial home boasting a full finished basement, offering additional living space and endless possibilities. Step inside to discover the allure of French doors leading to a beautiful den adorned with bamboo wood floors, c...

$650,000
$650,000
Available: Right Now
Discover The Charm Of Baldwin Living In This Meticulously Maintained Home, Boasting A Spacious Living Room, Dining Room, And A Well-Appointed Gas Kitchen. Enjoy Three Generous Bedrooms And Explore Additional Features Like A Separate Outside Entrance ...
$1,2M
$1,2M
Available: Right Now
Welcome to this inviting center hall colonial in the heart of the coveted Rockville Centre! Ideally located near downtown RVC and the Rockville Centre Links Golf Club, this home offers both convenience and charm. As you step inside, you're greeted by...
$549,000
$549,000
Available: Right Now
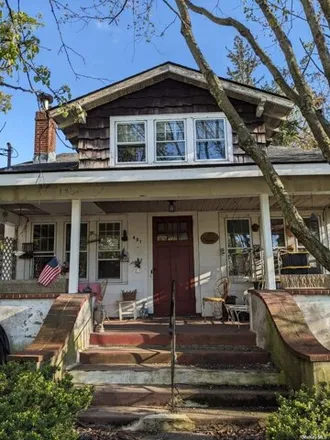
Welcome to 481 Archer Street Built in 1923-the Roaring Twenties in America! Make This Nostalgic Home Your Next Renovation Project! This Deceivingly Large Two-Story Bungalow Style Home Features A Big, Welcoming Living Room w Fire Place, Formal Dining ...

$799,000
$799,000
Available: Right Now
Huge Hi-Ranch with tons of possibilities. Featuring 5 bedrooms, living room, dining room, eat-in-kitchen, and a large family room with a stunning fireplace.TV room and possible professional suite with its own separate entrance. Cathedral ceilings add...

$639,999
$639,999
Available: Right Now
Wide line high ranch in the Rockville centre school district ! Never on the market before.. Large eat in kitchen, Living room and dining area. Primary bedroom with double closet. 2 additional bedrooms, and hall bathroom complete the top floor....

$799,999
$799,999
Available: Right Now
This newly renovated 6 bedroom, 3 bath house in Baldwin, sits on a quiet dead-end block. Where comfort meets convenience it is also located nearby schools, parks, shopping centers, restaurants, and more for easy access to everyday amenities. The firs...

$519,000
$519,000
Available: Right Now
Nestled in a prime location, this charming property boasts 3 bedrooms with cathedral ceilings, 1.5 bathrooms and a cozy living room with a fireplace, ideal for relaxing evenings. The full unfinished basement offers potential for customization to suit...

$549,000
$549,000
Available: Right Now
Welcome To 581 Grimm Place! This 3 Bedroom, 1.5 Bath Colonial Is Situated On.23 Of An Acre On A Well Maintained, Tree Lined Block. Large, Flat Property With Long Driveway And Detached 1 Car Garage. Near Shopping And Public Transportation. The Home Fe...

$1,35M
$1,35M
Available: Right Now
Introducing 478 Kent Court this3, 382Square foot 5 Bedroom, 3 Bathroom Contemporary. The Main Level Features an Entrance Hall with a 17 Foot Ceiling and Skylight which flows to a Living Room, Sitting Room and Mudroom, 2 Bedrooms and a Full Bathroom. ...

$1,19M
$1,19M
Available: Right Now
Don't miss out! Embrace waterfront living at its finest. This stunning home on the canal has captivating views. Located within the Oceanside school district. It presents with 4 bedrooms 2.5 bathrooms, brick fireplace, spacious living room and a separ...

$669,000
$669,000
Available: Right Now
Lovley neighborhood close to everything. Enter this traditional Tudor through a classic foyer into the living room and dining area with hard wood floors and an abundance of natural light. The kitchen equipped with granite counters and stainless appli...
$899,000
$899,000
Available: Right Now
Welcoming Center Hall in the Village of RVC! Charming and spacious throughout with plenty of room for entertaining ! Large entry foyer flows into LR w/ FPL or Formal Dining Room ! The Large Eat in Kitchen opens to the Family room with windows overloo...
$499,900
$499,900
Available: Right Now
This is a golden opportunity for handymen to finish a house to their liking with the desired quality. The house is located in an excellent location surrounded by woods and is very quiet. It comes with a one-car attached garage and driveway and offers...

$1,6M
$1,6M
Available: Right Now
Nest Seekers proudly presents this stunning new construction home built by a local, reputable builder, located in the heart of the highly desirable area of Oceanside, just in time for summer 2024! Situated mid-block on a massive 60 x 212 sf lot, this...

$599,000
$599,000
Available: Right Now
Excellent colonial style home on a 50 x 157 lot size in Baldwin. This home features a renovated eat-in-kitchen, renovated 2 full bathrooms, 3 bedrooms, hardwood floors throughout, full basement with open space and outside entrance, and front porch. E...

$640,000
$640,000
Available: Right Now
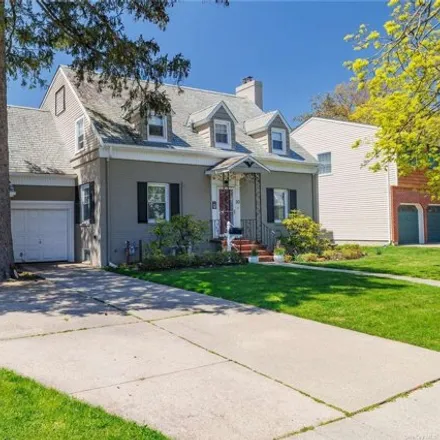
This Charming Cape Cod Home In RVC With Oceanside Schools Is A Family Delight! Large Updated Eat In Kitchen With Stainless Steel Appliances. Welcoming Large Living Room, Complete With A Wood Burning Fireplace. Large Dining Room With Large Windows Flo...
$739,000
$739,000
Available: Right Now
Welcome to your dream home! Nestled in a delightful corner of tranquility. While situated in a quiet neighborhood, enjoy the serenity while being just a stone's throw away from the highway. Ensuring easy connectivity to your favorite destinations. Th...
$949,000
$949,000
Available: Right Now
Welcome to this one of a kind colonial home situated on a huge park like property. The entire home was gutted in 2022 and built to the standards of a new construction. Enter through your enclosed front porch leading to a charming entry foyer. Easy fl...

$599,999
$599,999
Available: Right Now
Welcome To Our Charming Mid-Block Home in Derby's of Oceanside! This 4 Bedroom 2 Bath Home Is Waiting for Your Personal Touch. Plenty of Natural Light Throughout The Main Floor, Detached Garage and a Gorgeous Yard Perfect for Entertaining ! Flood Zon...
Baldwin
According to statistics, the population in Baldwin, NY amounts to 25,214, which shows decline 1% compared to the previous year. The median age of the city’s residents is 40. The average household income is $99,128, shifting growth 6% from the past year, and the average property value in Baldwin, NY growth 2% to $363,100 throughout the year.
| Population | 25,214 |
| Median Age | 40.2 |
| Poverty Rate | 6% |
| Household Income | $99,128 |
| Number Of Employees | 12,700 |
| Median Property Value | $363,100 |
What is the Average Price of Apartments for Sale in Baldwin, NY?
| Month | Median Price |
|---|---|
| Jun 2024 |
$422,451
|
| May 2024 |
$363,349
|
| Apr 2024 |
$397,839
|
| Mar 2024 |
$397,839
|
| Feb 2024 |
$397,839
|
| Jan 2024 |
$397,839
|
| Month | Median Price |
|---|---|
| Jun 2024 |
$474,420
|
| May 2024 |
$426,017
|
| Apr 2024 |
$429,312
|
| Mar 2024 |
$429,312
|
| Feb 2024 |
$429,312
|
| Jan 2024 |
$429,312
|
Household Income
The average household income in Baldwin, NY grew from $93,639 to $99,128 in the past year. This data is an estimate based upon 7,908 households in Baldwin, NY . The chart below presents how household income is distributed in Baldwin, NY in comparison to the revenue allocation amid households nationally.
Property Value
According to data from last year, the average property value in Baldwin, NY shifted from $356,300 to $363,100 throughout the year. The subsequent graph indicates the share of properties in the given price range in Baldwin, NY in comparison to the median property value in the same price segment across the country. According to the data, the greatest share of Baldwin, NY properties falls in the '$300,000 to $399,999' range, which is higher than the most significant median property across the country.
Rent vs. Own
Property Taxes
One of the most important aspects for property owners is the amount of property taxes. This graph shows distribution of property taxes in Baldwin, NY compared to median property taxes around the country. The prevalent amount of property taxes in Baldwin, NY equals $3000, which is less than the national average.