Bass Lake, CA, USA apartments for sale

$969,000
$969,000
Available: Right Now
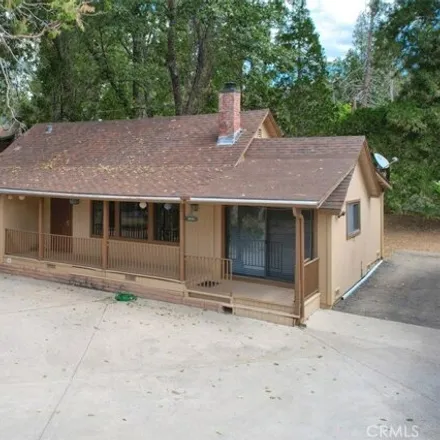
Stunning, beautifully maintained home just steps from Bass lake. Literally just a short walk from the lake- This4 BEDROOM 2.5bathroom home in the highly sought after North Shore Estates is the perfect balance of luxury and comfort. Offering2, ...

$1,58M
$1,58M
Available: Right Now
Stunning updated Bass Lake Tri-level home with all the bells and whistles! Upon entry, you're greeted with warmth, beauty, and relaxation. The main level showcases great room with soaring ceilings which opens to the chef's kitchen featuring high end ...

$299,950
$299,950
Available: Right Now
Charming Bass Lake Cabin Retreat Welcome to 52815 Balsam Drive, a delightful cabin nestled in the serene Bass Lake Heights community, approx. 1.5 hours from Yosemite and 15 min. to Bass Lake. This cozy +/-850 sq. ft. home offers a perfect escape and ...

$4,4M
$4,4M
Available: Right Now
Lakefront beauty and Two homes! Main home is 4 bedrooms 2 baths with walk out on main and lower level to deck and patio areas overlooking the lake. Watch fireworks from your own private dock. Guest home is 2 bedrooms 1 full bath, game room with separ...

$559,000
$559,000
Available: Right Now
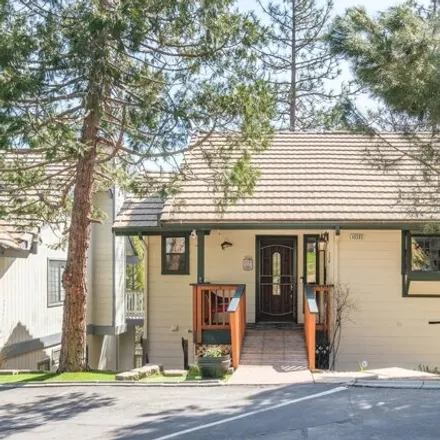
Superb location walking distance to the Pines Village! One of the original Bass Lake cabins, this home was remodeled in the 1990's and updated in 2019. Beautiful wood floors and wood accents to keep that desirable cabin charm! Sip your coffee at the ...

$799,000
$799,000
Available: Right Now
Vintage Bass Lake Cabin filled with history and charm! 1955 cabin has remained in one family since it was built, and has never been used as a vacation rental. With 3 bedrooms, 2 1/2baths, and a detached one car garage, the home had a tree fall on it ...
$519,900
$519,900
Available: Right Now
Welcome to the Ridgeline Home at beautiful Bass Lake. The home has 2 1/2 baths and 3 bedrooms in the main living area and a full guest quarters with a private entrance on the lower level. The home offers updated flooring and a beautiful upgraded kitc...

$1,45M
$1,45M
Available: Right Now
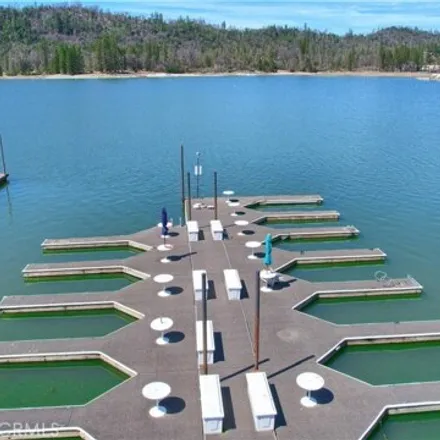
Located in the highly desirable Willow Cove, this incredible property comes with a deep water boat slip at Sheriff's Tower dock and is situated on one of the larger lots in Bass Lake. t has a detached oversized one-car garage/shop, room for 8+ cars o...
$1,1M
$1,1M
Available: Right Now
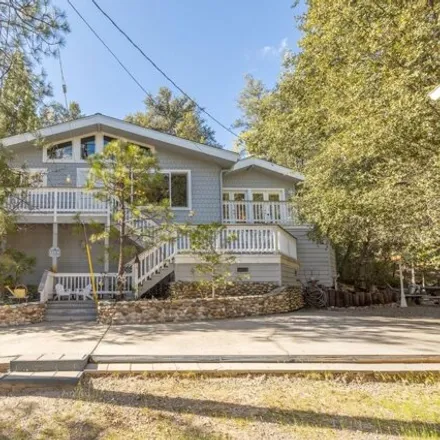
Located in the Pines Village with a boat slip down the street on Beaver dock, this 1700+ square foot home not only has a lake view from the living room, but has forest land on both sides for privacy. Enter the cabin into the large, open living space ...

$299,999
$299,999
Available: Right Now
This is a wonderful and rare opportunity to own a home in this area under 300K, especially in Bass Lake Heights! The property is being sold As Is, but it is already a charmer! This property would be perfect for a vacation home or as an AirBnB! Gorgeo...
$1,2M
$1,2M
Available: Right Now
Charming, Warm and inviting Bass Lake Mountain Cabin with lake views and and a boat slip on Acorn Dock. Updated in 2008, slate flooring granite countertops, custom cabinetry, replica antique stove, stained glass windows, custom copper sinks, custom c...
$878,700
$878,700
Available: Right Now
Updated home in popular Willow Cove, offers newer flooring, countertops, sinks. 2 bedrooms and 1 bathroom on main level along with kitchen and living room, deck offers space to bbq and enjoy the outdoors. Lower level offers, family room, 2 bedrooms a...

$469,000
$469,000
Available: Right Now
A beautifully renovated cozy cabin located in Bass Lake Heights with amazing Bass Lake views! Beautiful modern kitchen renovations include quartz countertops, tile back splash, custom alder cabinets, stainless steel appliances, a dishwasher, gas stov...

$349,000
$349,000
Available: Right Now
Close to the shore of Bass Lake you will find this affordable home in the exclusive Ridgeline neighborhood. This adorable home offers a great floor plan with vaulted ceilings, new faux wooden, laminate floors throughout and large windows to bring in ...
$799,000
$799,000
Available: Right Now
Absolutely beautifully updated Bass Lake cottage with a peak of the lake view! Lovely and stylish interior and the furnishings are included! The spacious living room has a tiled fireplace and hardwood flooring. The kitchen has a center island with st...

$780,000
$780,000
Available: Right Now
Are you looking for a quiet and modern cabin in Bass Lake, with all the elements in mind, this beautiful cabin has been recently remodeled from top to bottom and is completely turnkey? A short drive from Basslake Village and a 25-minute drive from Yo...

$1,55M
$1,55M
Available: Right Now
Take in the WOW factor of this sprawling and exquisite custom-built home with absolutely show-stopping views of Bass Lake! Pictures and words cannot do this home any justice! Upon entering this 4106 square foot multi-level masterpiece, one will appre...

$1,35M
$1,35M
Available: Right Now
Indulge in the ultimate lakeside lifestyle at this exceptional vacation rental property on the North shore of Bass Lake, offering lakefront magnificence, without lakefront pricing. Tailored to accommodate a large family or group seamlessly, this exqu...

$3,88M
$3,88M
Available: Right Now
Stunning Lake Front Home with your very own private boat dock with unobstructed lake views of the water from each floor of this 3 story custom home completed in 2016.The main floor living offers beautiful vaulted ceilings from reclaimed barn wood, cu...

$697,000
$697,000
Available: Right Now
Gated Slide Creek Estates at Bass Lake! This single family 4 bedroom 3 1/2 bathrooms backs to Slide Creek. Tile flooring in living room, kitchen and dining areas as well as bathrooms. Bedrooms are carpeted. Open floor plan with a large living room, p...

$1,3M
$1,3M
Available: Right Now
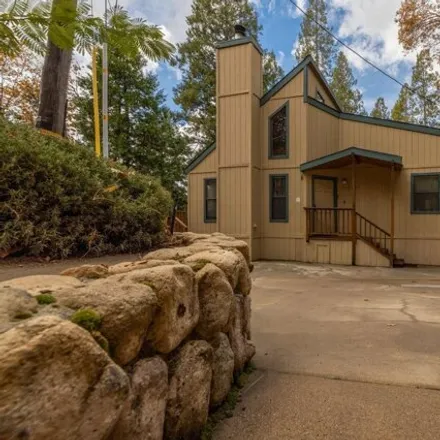
Nestled amidst towering pines and tranquil wilderness, this charming cabin offers a perfect retreat from city life. With a golf cart included you're just under a 1-minute ride down to your gated boat slip with golf cart parking at Pier #12 in the pop...
$385,000
$385,000
Available: Right Now
A turnkey 3 bedroom, plus another bonus room in Ridgeline Homes located at desirable Bass Lake. Located just minutes to the lake and approximately 14 miles to the southern gate of Yosemite National Park. No steps to the front door to enter into an op...
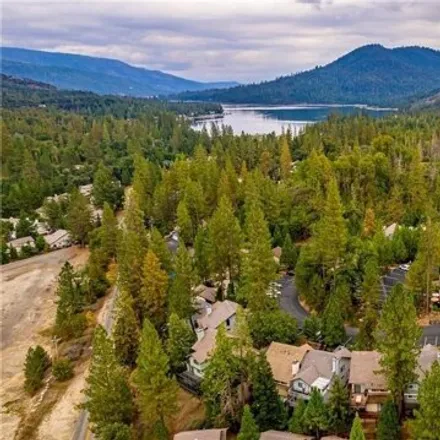
Bass Lake
According to statistics, the population in Bass Lake, CA amounts to 571, which shows growth 17% compared to the previous year. The median age of the city’s residents is 64. The average household income is $77,361, shifting growth 113% from the past year, and the average property value in Bass Lake, CA growth 27% to $623,900 throughout the year.
| Population | 571 |
| Median Age | 63.9 |
| Poverty Rate | 1% |
| Household Income | $77,361 |
| Number Of Employees | 210 |
| Median Property Value | $623,900 |
Household Income
The average household income in Bass Lake, CA grew from $36,292 to $77,361 in the past year. This data is an estimate based upon 285 households in Bass Lake, CA . The chart below presents how household income is distributed in Bass Lake, CA in comparison to the revenue allocation amid households nationally.
Property Value
According to data from last year, the average property value in Bass Lake, CA shifted from $490,000 to $623,900 throughout the year. The subsequent graph indicates the share of properties in the given price range in Bass Lake, CA in comparison to the median property value in the same price segment across the country. According to the data, the greatest share of Bass Lake, CA properties falls in the '$500,000 to $749,999' range, which is higher than the most significant median property across the country.
Rent vs. Own
Property Taxes
One of the most important aspects for property owners is the amount of property taxes. This graph shows distribution of property taxes in Bass Lake, CA compared to median property taxes around the country. The prevalent amount of property taxes in Bass Lake, CA equals $3000, which is less than the national average.